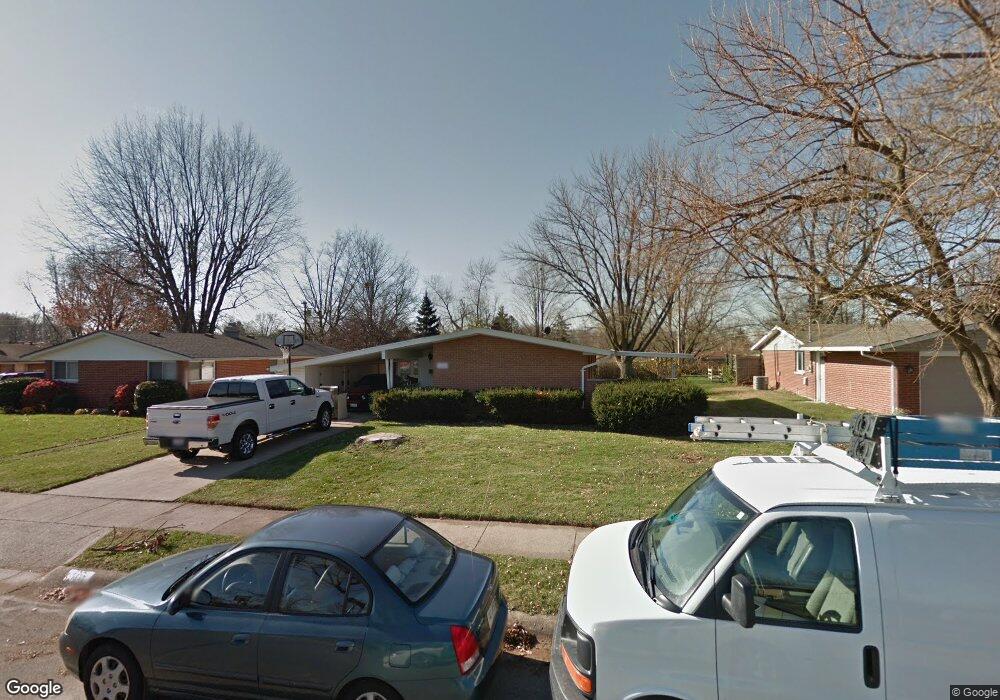
1331 Mapleridge Dr Fairborn, OH 45324
Estimated Value: $186,000 - $208,000
3
Beds
2
Baths
1,153
Sq Ft
$171/Sq Ft
Est. Value
About This Home
This home is located at 1331 Mapleridge Dr, Fairborn, OH 45324 and is currently estimated at $197,486, approximately $171 per square foot. 1331 Mapleridge Dr is a home located in Greene County with nearby schools including Fairborn Primary School, Fairborn Intermediate School, and Fairborn Middle School.
Ownership History
Date
Name
Owned For
Owner Type
Purchase Details
Closed on
Mar 23, 2022
Sold by
Westfall Bradley Michael and Westfall Eugenia Eliza
Bought by
Harris Helen Heather
Current Estimated Value
Home Financials for this Owner
Home Financials are based on the most recent Mortgage that was taken out on this home.
Original Mortgage
$142,000
Outstanding Balance
$111,103
Interest Rate
3.14%
Mortgage Type
New Conventional
Estimated Equity
$86,383
Purchase Details
Closed on
Apr 18, 2016
Sold by
Overton Phyllis S
Bought by
Westfall Eugenia Elizabeth and Westfall Bradley Michael
Home Financials for this Owner
Home Financials are based on the most recent Mortgage that was taken out on this home.
Original Mortgage
$86,896
Interest Rate
3.99%
Mortgage Type
FHA
Purchase Details
Closed on
Apr 12, 2010
Sold by
Goodwin Sarah L
Bought by
Goodwin Sarah L and Overton Phyllis S
Purchase Details
Closed on
Jan 1, 1988
Bought by
Overton Phyllis S
Create a Home Valuation Report for This Property
The Home Valuation Report is an in-depth analysis detailing your home's value as well as a comparison with similar homes in the area
Home Values in the Area
Average Home Value in this Area
Purchase History
| Date | Buyer | Sale Price | Title Company |
|---|---|---|---|
| Harris Helen Heather | $157,000 | None Listed On Document | |
| Westfall Eugenia Elizabeth | $14,000 | None Available | |
| Goodwin Sarah L | -- | None Available | |
| Overton Phyllis S | $50,000 | -- |
Source: Public Records
Mortgage History
| Date | Status | Borrower | Loan Amount |
|---|---|---|---|
| Open | Harris Helen Heather | $142,000 | |
| Previous Owner | Westfall Eugenia Elizabeth | $86,896 |
Source: Public Records
Tax History
| Year | Tax Paid | Tax Assessment Tax Assessment Total Assessment is a certain percentage of the fair market value that is determined by local assessors to be the total taxable value of land and additions on the property. | Land | Improvement |
|---|---|---|---|---|
| 2025 | $2,674 | $55,440 | $10,450 | $44,990 |
| 2024 | $2,674 | $55,440 | $10,450 | $44,990 |
| 2023 | $2,655 | $55,440 | $10,450 | $44,990 |
| 2022 | $1,657 | $29,810 | $8,040 | $21,770 |
| 2021 | $1,682 | $29,810 | $8,040 | $21,770 |
| 2020 | $1,690 | $29,810 | $8,040 | $21,770 |
| 2019 | $1,465 | $25,920 | $7,940 | $17,980 |
| 2018 | $1,481 | $25,920 | $7,940 | $17,980 |
| 2017 | $1,447 | $25,920 | $7,940 | $17,980 |
| 2016 | $1,481 | $25,920 | $7,940 | $17,980 |
| 2015 | $1,410 | $25,920 | $7,940 | $17,980 |
| 2014 | $681 | $25,920 | $7,940 | $17,980 |
Source: Public Records
Map
Nearby Homes
- 1878 Wildflower Rd
- 1267 Beech St
- 1408 Mapleridge Dr
- 0 W Garland Ave
- 1237 Hemlock Dr
- 1108 Lexington Ave
- 201 State St
- 1373 Rawlings Dr
- 12 Canova Ct
- 234-236 High St
- 38 Lindway Dr
- 167 W Goodman Dr
- 45 Regina Dr
- 421 Marchmont Dr
- 349 Forest St
- 818 Flintridge Dr
- 849 Flintridge Dr
- 267 Pat Ln
- 15 Diana Ln N
- 153 Diana Ln N
- 1327 Mapleridge Dr
- 1335 Mapleridge Dr
- 1339 Mapleridge Dr
- 1315 Mapleridge Dr
- 1332 Maplegrove Dr
- 1336 Maplegrove Dr
- 1328 Maplegrove Dr
- 1343 Mapleridge Dr
- 1332 Mapleridge Dr
- 1336 Mapleridge Dr
- 1328 Mapleridge Dr
- 1340 Mapleridge Dr
- 1344 Maplegrove Dr
- 1324 Mapleridge Dr
- 1347 Mapleridge Dr
- 1344 Mapleridge Dr
- 1310 Mapleridge Dr
- 1348 Maplegrove Dr
- 1314 Mapleridge Dr
- 1320 Mapleridge Dr
Your Personal Tour Guide
Ask me questions while you tour the home.