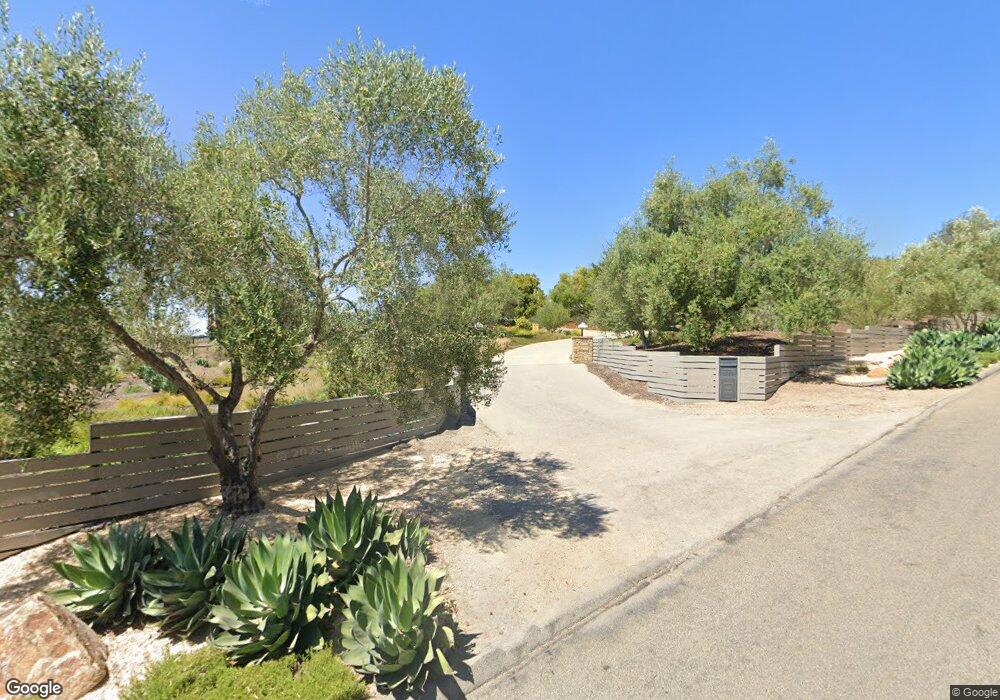
1331 Tiffany Ranch Rd Arroyo Grande, CA 93420
Estimated Value: $3,611,556 - $5,559,000
7
Beds
7
Baths
6,157
Sq Ft
$764/Sq Ft
Est. Value
About This Home
This home is located at 1331 Tiffany Ranch Rd, Arroyo Grande, CA 93420 and is currently estimated at $4,702,852, approximately $763 per square foot. 1331 Tiffany Ranch Rd is a home located in San Luis Obispo County with nearby schools including Harloe Elementary School, Paulding Middle School, and Arroyo Grande High School.
Ownership History
Date
Name
Owned For
Owner Type
Purchase Details
Closed on
Jul 27, 2016
Sold by
Schoniger Wendle
Bought by
Baughman Chris and Baughman Chelsie
Current Estimated Value
Home Financials for this Owner
Home Financials are based on the most recent Mortgage that was taken out on this home.
Original Mortgage
$2,280,000
Outstanding Balance
$1,782,510
Interest Rate
2.87%
Mortgage Type
Adjustable Rate Mortgage/ARM
Estimated Equity
$2,920,342
Purchase Details
Closed on
Jun 17, 2014
Sold by
Heill Duane
Bought by
Schoniger Wendle
Purchase Details
Closed on
Apr 18, 2007
Sold by
Dw August Co
Bought by
Heil Duane and Schoniger Wendy
Purchase Details
Closed on
Feb 15, 2005
Sold by
Bottrell Irene M
Bought by
Dw August Co
Home Financials for this Owner
Home Financials are based on the most recent Mortgage that was taken out on this home.
Original Mortgage
$324,500
Interest Rate
5.79%
Mortgage Type
Seller Take Back
Create a Home Valuation Report for This Property
The Home Valuation Report is an in-depth analysis detailing your home's value as well as a comparison with similar homes in the area
Home Values in the Area
Average Home Value in this Area
Purchase History
| Date | Buyer | Sale Price | Title Company |
|---|---|---|---|
| Baughman Chris | $2,850,000 | First American Title Company | |
| Schoniger Wendle | -- | None Available | |
| Heil Duane | -- | Accommodation | |
| Dw August Co | $999,500 | Fidelity Title Company |
Source: Public Records
Mortgage History
| Date | Status | Borrower | Loan Amount |
|---|---|---|---|
| Open | Baughman Chris | $2,280,000 | |
| Previous Owner | Dw August Co | $324,500 |
Source: Public Records
Tax History Compared to Growth
Tax History
| Year | Tax Paid | Tax Assessment Tax Assessment Total Assessment is a certain percentage of the fair market value that is determined by local assessors to be the total taxable value of land and additions on the property. | Land | Improvement |
|---|---|---|---|---|
| 2025 | $34,022 | $3,307,665 | $1,740,877 | $1,566,788 |
| 2024 | $33,632 | $3,242,810 | $1,706,743 | $1,536,067 |
| 2023 | $33,632 | $3,179,227 | $1,673,278 | $1,505,949 |
| 2022 | $33,125 | $3,116,890 | $1,640,469 | $1,476,421 |
| 2021 | $33,064 | $3,055,775 | $1,608,303 | $1,447,472 |
| 2020 | $32,686 | $3,024,442 | $1,591,812 | $1,432,630 |
| 2019 | $32,486 | $2,965,140 | $1,560,600 | $1,404,540 |
| 2018 | $32,099 | $2,907,000 | $1,530,000 | $1,377,000 |
| 2017 | $31,498 | $2,850,000 | $1,500,000 | $1,350,000 |
| 2016 | $22,600 | $2,132,655 | $1,221,736 | $910,919 |
| 2015 | $22,275 | $2,100,622 | $1,203,385 | $897,237 |
| 2014 | $19,509 | $1,874,000 | $1,075,000 | $799,000 |
Source: Public Records
Map
Nearby Homes
- 1505 Tiffany Ranch Rd
- 1604 Tiffany Ranch Rd
- 1640 Corbett Canyon Rd
- 1685 Corbett Highlands Place
- 1665 Corbett Highlands Place
- 2139 Verde Canyon Rd
- 1110 Deer Canyon Rd
- 1398 Deer Canyon Rd
- 1592 Deer Canyon Rd
- 2545 Nightshade Place
- 1635 Bee Canyon Rd
- 1186 Ramblin Rose Way
- 1250 Manzanita Ct
- 2310 Oak Haven Ln
- 2356 Oak Haven Ln
- 455 Mission Springs Rd
- 1155 Carpenter Canyon Rd
- 665 Heritage Ln
- 625 W Ormonde Rd
- 225 Pioneer Cir
- 1232 Tiffany Ranch Rd
- 1355 Tiffany Ranch Rd
- 1215 Tiffany Ranch Rd
- 1414 Tiffany Ranch Rd
- 1250 Judith Ln
- 1455 Tiffany Ranch Rd
- 1450 Tiffany Ranch Rd
- 1222 Tiffany Ranch Rd
- 1195 Tiffany Ranch Rd
- 2112 Corbett Canyon Rd
- 1145 Tiffany Ranch Rd
- 1150 Tiffany Ranch Rd
- 2195 Corbett Canyon Rd
- 1798 Corbett Canyon Rd
- 1826 Corbett Canyon Rd
- 25 Nosara Travel Rd
- 1475 Tiffany Ranch Rd
- 1504 Tiffany Ranch Rd
- 1606 Tiffany Ranch Rd