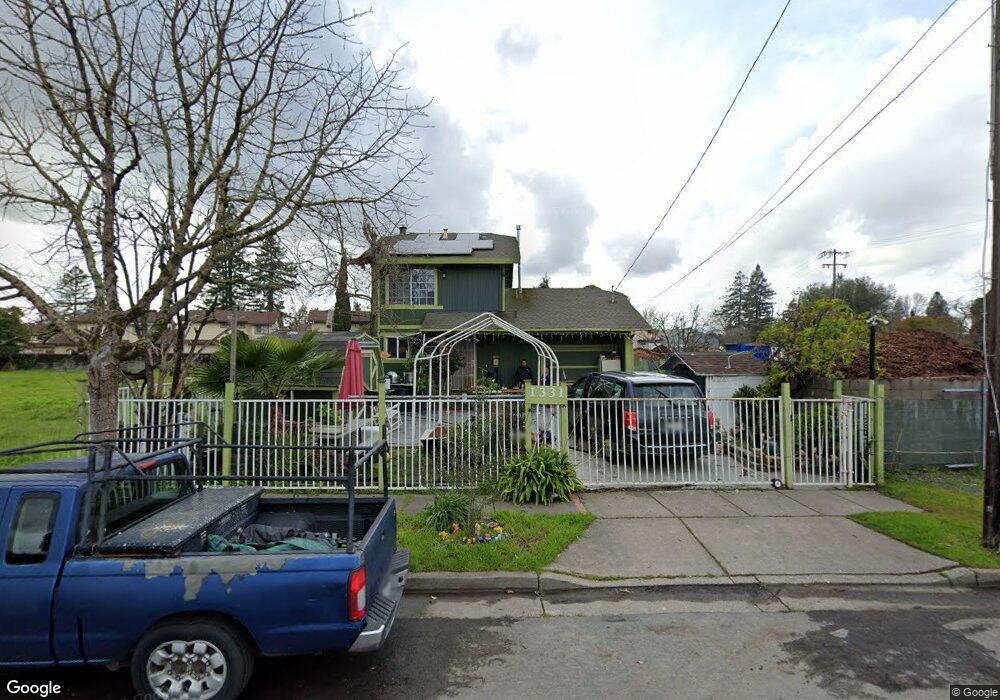
1331 Wright St Santa Rosa, CA 95404
Junior College NeighborhoodEstimated Value: $652,876 - $777,000
3
Beds
2
Baths
1,142
Sq Ft
$636/Sq Ft
Est. Value
About This Home
This home is located at 1331 Wright St, Santa Rosa, CA 95404 and is currently estimated at $725,969, approximately $635 per square foot. 1331 Wright St is a home located in Sonoma County with nearby schools including Proctor Terrace Elementary School, Santa Rosa Middle School, and Santa Rosa High School.
Ownership History
Date
Name
Owned For
Owner Type
Purchase Details
Closed on
Nov 8, 2004
Sold by
Avila Gabriela and Escalona Gabriela
Bought by
Avila Santiago
Current Estimated Value
Home Financials for this Owner
Home Financials are based on the most recent Mortgage that was taken out on this home.
Original Mortgage
$355,000
Outstanding Balance
$163,327
Interest Rate
4.62%
Mortgage Type
New Conventional
Estimated Equity
$562,642
Purchase Details
Closed on
May 28, 1999
Sold by
Blondino Charles and The Pauline Barstow Trust
Bought by
Avila Santiago and Escalona Gabriela
Home Financials for this Owner
Home Financials are based on the most recent Mortgage that was taken out on this home.
Original Mortgage
$156,800
Interest Rate
7.01%
Mortgage Type
Balloon
Purchase Details
Closed on
May 3, 1995
Sold by
Barstow Pauline S
Bought by
Barstow Pauline S and The Pauline Barstow Living Tru
Create a Home Valuation Report for This Property
The Home Valuation Report is an in-depth analysis detailing your home's value as well as a comparison with similar homes in the area
Home Values in the Area
Average Home Value in this Area
Purchase History
| Date | Buyer | Sale Price | Title Company |
|---|---|---|---|
| Avila Santiago | -- | North Bay Title Co | |
| Avila Santiago | $196,000 | Northwestern Title Security | |
| Barstow Pauline S | -- | -- |
Source: Public Records
Mortgage History
| Date | Status | Borrower | Loan Amount |
|---|---|---|---|
| Open | Avila Santiago | $355,000 | |
| Closed | Avila Santiago | $156,800 | |
| Closed | Avila Santiago | $39,200 |
Source: Public Records
Tax History
| Year | Tax Paid | Tax Assessment Tax Assessment Total Assessment is a certain percentage of the fair market value that is determined by local assessors to be the total taxable value of land and additions on the property. | Land | Improvement |
|---|---|---|---|---|
| 2025 | $3,412 | $307,253 | $117,569 | $189,684 |
| 2024 | $3,412 | $301,229 | $115,264 | $185,965 |
| 2023 | $3,412 | $295,323 | $113,004 | $182,319 |
| 2022 | $3,149 | $289,534 | $110,789 | $178,745 |
| 2021 | $3,109 | $283,858 | $108,617 | $175,241 |
| 2020 | $3,102 | $280,949 | $107,504 | $173,445 |
| 2019 | $3,084 | $275,442 | $105,397 | $170,045 |
| 2018 | $3,065 | $270,042 | $103,331 | $166,711 |
| 2017 | $3,009 | $264,748 | $101,305 | $163,443 |
| 2016 | $2,981 | $259,558 | $99,319 | $160,239 |
| 2015 | $2,890 | $255,661 | $97,828 | $157,833 |
| 2014 | $2,713 | $250,654 | $95,912 | $154,742 |
Source: Public Records
Map
Nearby Homes
- 1055 Wright St
- 1320 North St Unit 7
- 1102 North St
- 1404 Slater St
- 1136 Poppy Dr
- 1829 Wright St
- 1016 Spring St
- 722 Beaver St
- 705 College Ave
- 900 Cherry St
- 2149 Humboldt St
- 810 7th St Unit 24
- 1644 Julianne Place
- 312 Benton St
- 418 Humboldt St
- 1944 Grosse Ave
- 265 Doyle Park Dr
- 2126 Northwood Dr
- 136 Alderbrook Dr
- 547 B St
Your Personal Tour Guide
Ask me questions while you tour the home.