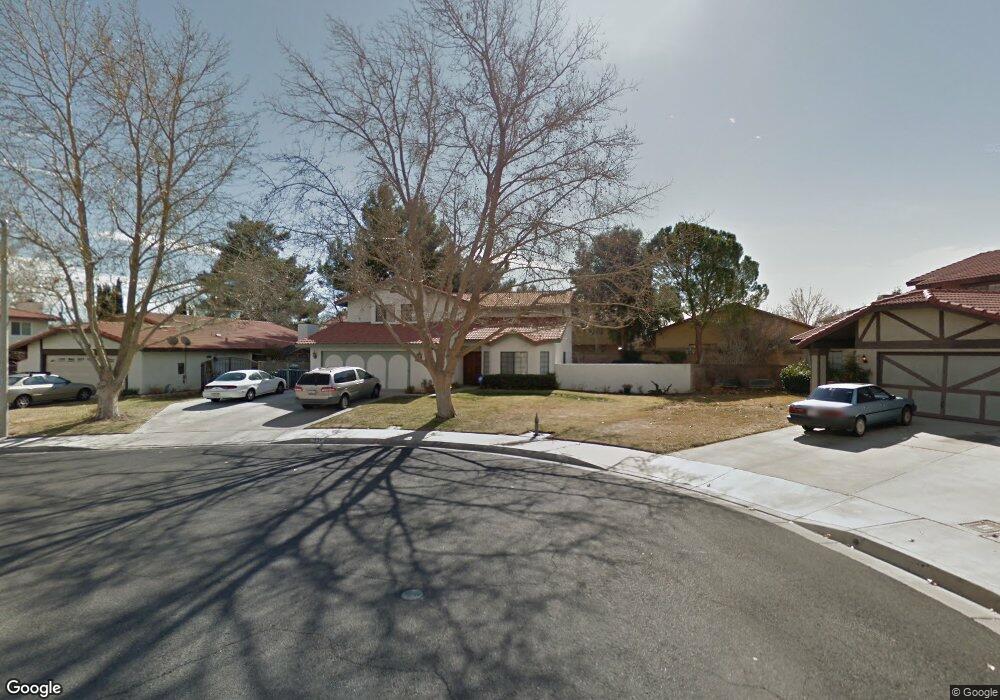
1334 Sun Ct Lancaster, CA 93535
East Lancaster NeighborhoodEstimated Value: $476,000 - $511,000
3
Beds
3
Baths
2,449
Sq Ft
$202/Sq Ft
Est. Value
About This Home
This home is located at 1334 Sun Ct, Lancaster, CA 93535 and is currently estimated at $493,714, approximately $201 per square foot. 1334 Sun Ct is a home located in Los Angeles County with nearby schools including Lincoln Elementary School, New Vista Middle School, and Eastside High School.
Ownership History
Date
Name
Owned For
Owner Type
Purchase Details
Closed on
Aug 1, 2023
Sold by
Routolo Brenda L
Bought by
R And B Routolo Family Trust and Routolo
Current Estimated Value
Purchase Details
Closed on
Dec 31, 1999
Sold by
Coleman David K
Bought by
Routolo Ronald A and Routolo Brenda L
Home Financials for this Owner
Home Financials are based on the most recent Mortgage that was taken out on this home.
Original Mortgage
$123,200
Interest Rate
8.24%
Purchase Details
Closed on
Dec 24, 1997
Sold by
Coleman Debra C
Bought by
Coleman David K
Purchase Details
Closed on
Sep 17, 1997
Sold by
Standley Steven L and Standley Linda M
Bought by
Coleman David K
Home Financials for this Owner
Home Financials are based on the most recent Mortgage that was taken out on this home.
Original Mortgage
$119,658
Interest Rate
7.16%
Mortgage Type
FHA
Create a Home Valuation Report for This Property
The Home Valuation Report is an in-depth analysis detailing your home's value as well as a comparison with similar homes in the area
Home Values in the Area
Average Home Value in this Area
Purchase History
| Date | Buyer | Sale Price | Title Company |
|---|---|---|---|
| R And B Routolo Family Trust | -- | None Listed On Document | |
| Routolo Ronald A | $154,000 | Equity Title | |
| Coleman David K | -- | Fidelity National Title Co | |
| Coleman David K | $120,000 | Fidelity National Title Co |
Source: Public Records
Mortgage History
| Date | Status | Borrower | Loan Amount |
|---|---|---|---|
| Previous Owner | Routolo Ronald A | $123,200 | |
| Previous Owner | Coleman David K | $119,658 |
Source: Public Records
Tax History
| Year | Tax Paid | Tax Assessment Tax Assessment Total Assessment is a certain percentage of the fair market value that is determined by local assessors to be the total taxable value of land and additions on the property. | Land | Improvement |
|---|---|---|---|---|
| 2025 | $4,241 | $236,663 | $47,322 | $189,341 |
| 2024 | $4,241 | $232,024 | $46,395 | $185,629 |
| 2023 | $4,154 | $227,476 | $45,486 | $181,990 |
| 2022 | $3,947 | $223,017 | $44,595 | $178,422 |
| 2021 | $3,544 | $218,645 | $43,721 | $174,924 |
| 2019 | $3,444 | $212,162 | $42,425 | $169,737 |
| 2018 | $3,383 | $208,003 | $41,594 | $166,409 |
| 2016 | $3,195 | $199,929 | $39,980 | $159,949 |
| 2015 | $3,154 | $196,927 | $39,380 | $157,547 |
| 2014 | $3,132 | $193,070 | $38,609 | $154,461 |
Source: Public Records
Map
Nearby Homes
- 1311 Herzel Ave
- 1251 Herzel Ave
- 1311 Camran Ave
- 43815 Silver Bow Rd
- 43927 Fallon Dr
- 1217 Camran Ave
- 87 E Avenue J 12
- 117 E Avenue J 12
- 43922 Fallon Dr
- 1518 E Avenue j12
- 1518 E Avenue J-12
- 1565 Astoria Ave
- 43964 Fallon Dr
- 1144 E Avenue J 10
- 1144 E Avenue j10
- 1519 Michelle Ave
- 43743 Alain Ct
- 43903 11th St E
- 1517 E Avenue j6
- 0 11th St E
Your Personal Tour Guide
Ask me questions while you tour the home.