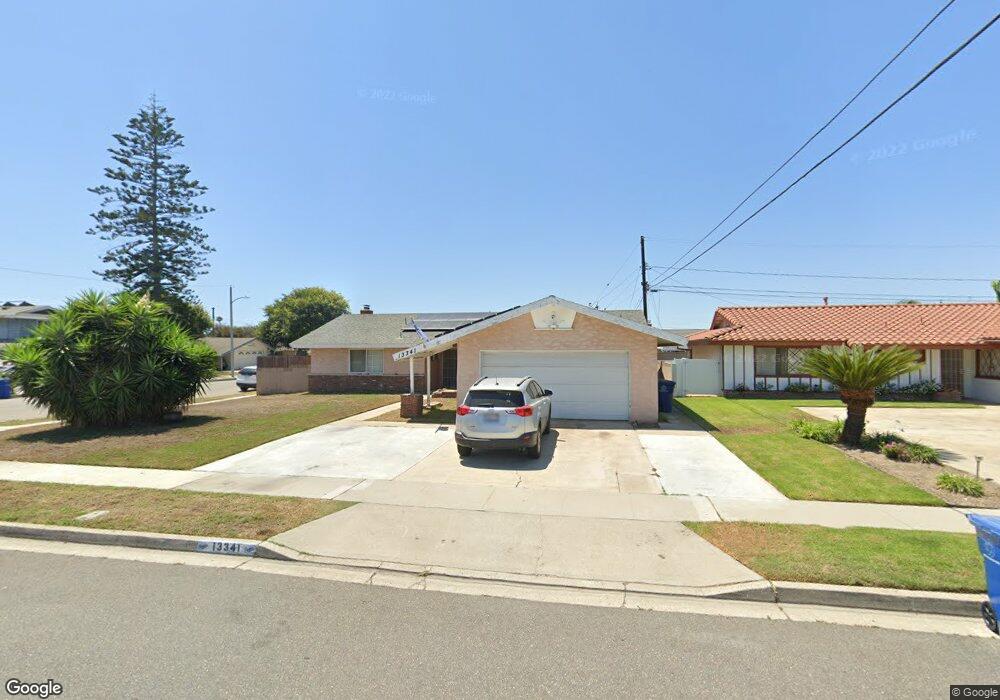
13341 Shasta Cir Westminster, CA 92683
Estimated Value: $1,001,316 - $1,144,000
4
Beds
2
Baths
1,654
Sq Ft
$644/Sq Ft
Est. Value
About This Home
This home is located at 13341 Shasta Cir, Westminster, CA 92683 and is currently estimated at $1,065,079, approximately $643 per square foot. 13341 Shasta Cir is a home located in Orange County with nearby schools including Fryberger Elementary, Johnson Middle, and Westminster High School.
Ownership History
Date
Name
Owned For
Owner Type
Purchase Details
Closed on
Sep 10, 2020
Sold by
Delahoussaye Chrystal J
Bought by
Delahoussaye Chrystal J and 2020 Chrystal J
Current Estimated Value
Purchase Details
Closed on
Oct 24, 1995
Sold by
Delahoussaye Russell J and Delahousaye Russell J
Bought by
Delahoussaye Russell J and Delahoussaye Chrystal J
Home Financials for this Owner
Home Financials are based on the most recent Mortgage that was taken out on this home.
Original Mortgage
$114,000
Outstanding Balance
$798
Interest Rate
7.58%
Estimated Equity
$1,064,281
Purchase Details
Closed on
Mar 15, 1994
Sold by
Delahoussaye Russell J and Delahoussaye Chrystal J
Bought by
Delahousaye Russell J and Delahoussaye Chrystal J
Home Financials for this Owner
Home Financials are based on the most recent Mortgage that was taken out on this home.
Original Mortgage
$110,000
Interest Rate
6.95%
Create a Home Valuation Report for This Property
The Home Valuation Report is an in-depth analysis detailing your home's value as well as a comparison with similar homes in the area
Home Values in the Area
Average Home Value in this Area
Purchase History
| Date | Buyer | Sale Price | Title Company |
|---|---|---|---|
| Delahoussaye Chrystal J | -- | None Available | |
| Delahoussaye Russell J | -- | Southland Title Corporation | |
| Delahousaye Russell J | -- | Gateway Title Company |
Source: Public Records
Mortgage History
| Date | Status | Borrower | Loan Amount |
|---|---|---|---|
| Open | Delahoussaye Russell J | $114,000 | |
| Closed | Delahousaye Russell J | $110,000 |
Source: Public Records
Tax History Compared to Growth
Tax History
| Year | Tax Paid | Tax Assessment Tax Assessment Total Assessment is a certain percentage of the fair market value that is determined by local assessors to be the total taxable value of land and additions on the property. | Land | Improvement |
|---|---|---|---|---|
| 2025 | $729 | $176,092 | $95,032 | $81,060 |
| 2024 | $729 | $172,640 | $93,169 | $79,471 |
| 2023 | $764 | $169,255 | $91,342 | $77,913 |
| 2022 | $830 | $165,937 | $89,551 | $76,386 |
| 2021 | $793 | $162,684 | $87,795 | $74,889 |
| 2020 | $817 | $161,016 | $86,894 | $74,122 |
| 2019 | $2,290 | $157,859 | $85,190 | $72,669 |
| 2018 | $2,285 | $154,764 | $83,519 | $71,245 |
| 2017 | $2,211 | $151,730 | $81,881 | $69,849 |
| 2016 | $2,152 | $148,755 | $80,275 | $68,480 |
| 2015 | $2,118 | $146,521 | $79,069 | $67,452 |
| 2014 | $2,074 | $143,651 | $77,520 | $66,131 |
Source: Public Records
Map
Nearby Homes
- 6751 Klondike Ave
- 13472 Willamette Dr
- 13592 Yosemite Dr
- Plan 2 at Solara
- Plan 1 at Solara
- Plan 3 at Solara
- 13221 Cedar St
- 6532 Bestel Ave
- 13671 Sutter Dr
- 13861 Pine St
- 7541 Benton Ave
- 7232 Wyoming St
- 13912 Cherry St
- 13688 Eastbridge St
- 6884 Almondine Dr
- 7603 23rd St
- 7565 23rd St
- 6949 Danvers Dr
- 13036 Springarden Ln
- 13040 Springarden Ln
- 13331 Shasta Cir
- 13342 Rainier Cir
- 13332 Rainier Cir
- 13311 Shasta Cir
- 6912 Bestel Ave
- 6922 Bestel Ave
- 13342 Shasta Cir
- 13392 Tahoe St
- 13312 Rainier Cir
- 13332 Shasta Cir
- 6902 Bestel Ave
- 6932 Bestel Ave
- 13301 Shasta Cir
- 13312 Shasta Cir
- 6892 Bestel Ave
- 13302 Rainier Cir
- 6942 Bestel Ave
- 13302 Shasta Cir
- 13341 Rainier Cir
- 13341 Mckinley Cir