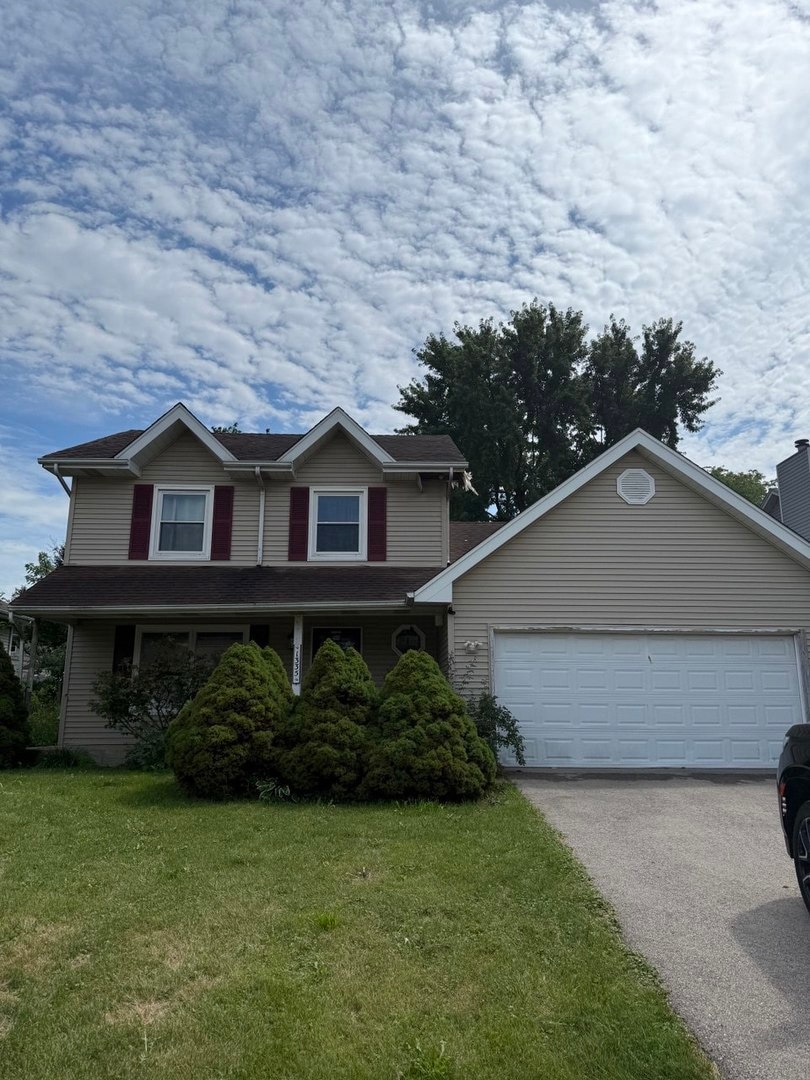
1335 Lawrence Ct Aurora, IL 60504
South East Village NeighborhoodEstimated payment $2,243/month
Highlights
- L-Shaped Dining Room
- Living Room
- Forced Air Heating and Cooling System
- Mill Street Elementary School Rated A+
- Laundry Room
- Ceiling Fan
About This Home
Short sale listing.
Listing Agent
Real Broker, LLC Brokerage Phone: (630) 439-6385 License #471019889 Listed on: 08/05/2025
Home Details
Home Type
- Single Family
Est. Annual Taxes
- $7,023
Year Built
- Built in 1988
Lot Details
- 9,148 Sq Ft Lot
- Lot Dimensions are 65x140
Parking
- 2 Car Garage
- Driveway
- Parking Included in Price
Home Design
- Asphalt Roof
- Concrete Perimeter Foundation
Interior Spaces
- 1,480 Sq Ft Home
- 2-Story Property
- Ceiling Fan
- Wood Burning Fireplace
- Family Room with Fireplace
- Living Room
- L-Shaped Dining Room
- Carpet
- Sump Pump
- Carbon Monoxide Detectors
- Dishwasher
Bedrooms and Bathrooms
- 3 Bedrooms
- 3 Potential Bedrooms
Laundry
- Laundry Room
- Dryer
- Washer
Utilities
- Forced Air Heating and Cooling System
- Heating System Uses Natural Gas
- 100 Amp Service
Community Details
- Hunters Ridge Subdivision
Listing and Financial Details
- Homeowner Tax Exemptions
Map
Home Values in the Area
Average Home Value in this Area
Tax History
| Year | Tax Paid | Tax Assessment Tax Assessment Total Assessment is a certain percentage of the fair market value that is determined by local assessors to be the total taxable value of land and additions on the property. | Land | Improvement |
|---|---|---|---|---|
| 2024 | $7,023 | $100,372 | $31,606 | $68,766 |
| 2023 | $6,680 | $90,190 | $28,400 | $61,790 |
| 2022 | $6,607 | $84,790 | $26,500 | $58,290 |
| 2021 | $6,427 | $81,760 | $25,550 | $56,210 |
| 2020 | $6,505 | $81,760 | $25,550 | $56,210 |
| 2019 | $6,269 | $77,760 | $24,300 | $53,460 |
| 2018 | $5,741 | $71,000 | $21,750 | $49,250 |
| 2017 | $5,639 | $68,590 | $21,010 | $47,580 |
| 2016 | $5,531 | $65,820 | $20,160 | $45,660 |
| 2015 | $5,464 | $62,490 | $19,140 | $43,350 |
| 2014 | $5,308 | $59,270 | $18,020 | $41,250 |
| 2013 | $5,254 | $59,680 | $18,140 | $41,540 |
Property History
| Date | Event | Price | List to Sale | Price per Sq Ft |
|---|---|---|---|---|
| 11/13/2025 11/13/25 | Pending | -- | -- | -- |
| 09/25/2025 09/25/25 | For Sale | $315,000 | 0.0% | $213 / Sq Ft |
| 09/24/2025 09/24/25 | Price Changed | $315,000 | +57.5% | $213 / Sq Ft |
| 08/13/2025 08/13/25 | Pending | -- | -- | -- |
| 08/05/2025 08/05/25 | For Sale | $200,000 | -- | $135 / Sq Ft |
Purchase History
| Date | Type | Sale Price | Title Company |
|---|---|---|---|
| Quit Claim Deed | -- | -- | |
| Warranty Deed | $155,000 | Attorneys Title Guaranty Fun |
Mortgage History
| Date | Status | Loan Amount | Loan Type |
|---|---|---|---|
| Open | $25,825 | No Value Available | |
| Previous Owner | $127,800 | FHA |
Source: Midwest Real Estate Data (MRED)
MLS Number: 12437114
APN: 07-31-410-029
Disclaimer: Certain information contained herein is derived from information provided by parties other than Homes.com. All information provided is deemed reliable, but is not guaranteed to be accurate and should be independently verified.
![]() Based on information submitted to the MLS GRID. All data is obtained from various sources and may not have been verified by broker or MLS GRID. Supplied Open House Information is subject to change without notice. All information should be independently reviewed and verified for accuracy. Properties may or may not be listed by the office/agent presenting the information. Some IDX listings have been excluded from this website.
Based on information submitted to the MLS GRID. All data is obtained from various sources and may not have been verified by broker or MLS GRID. Supplied Open House Information is subject to change without notice. All information should be independently reviewed and verified for accuracy. Properties may or may not be listed by the office/agent presenting the information. Some IDX listings have been excluded from this website.
The Digital Millennium Copyright Act of 1998, 17 U.S.C. § 512 (the “DMCA”) provides recourse for copyright owners who believe that material appearing on the Internet infringes their rights under U.S. copyright law. If you believe in good faith that any content or material made available in connection with our website or services infringes your copyright, you (or your agent) may send us a notice requesting that the content or material be removed, or access to it blocked.
Notices must be sent in writing by email to DMCAnotice@MLSGrid.com.
The DMCA requires that your notice of alleged copyright infringement include the following information:
(1) description of the copyrighted work that is the subject of claimed infringement;
(2) description of the alleged infringing content and information sufficient to permit us to locate the content;
(3) contact information for you, including your address, telephone number and email address;
(4) a statement by you that you have a good faith belief that the content in the manner complained of is not authorized by the copyright owner, or its agent, or by the operation of any law;
(5) a statement by you, signed under penalty of perjury, that the information in the notification is accurate and that you have the authority to enforce the copyrights that are claimed to be infringed; and
(6) a physical or electronic signature of the copyright owner or a person authorized to act on the copyright owner’s behalf. Failure to include all of the above information may result in the delay of the processing of your complaint.
- 2716 Leyland Ln
- 2860 Bridgeport Ln Unit 19D
- 2723 Emma Cir
- 2585 Autumn Grove Ct
- 3144 Johnsbury Ln
- 2723 Rosehall Ln
- 3290 Johnsbury Ct
- 2476 Village Ct Unit 2
- 2509 Rosehall Ln
- 1334 Normantown Rd Unit 334
- 2489 Rosehall Ln
- 1008 Pheasant Run Ln Unit 18C
- 3094 Timber Hill Ln Unit 13B
- 3130 Cambria Ct Unit 386
- 1672 Edinburgh Ln
- 2901 Shelly Ln
- 3467 Charlemaine Dr
- 2942 Shelly Ln Unit 25
- 2950 Shelly Ln Unit 2950
- 2484 Warwick Ct
