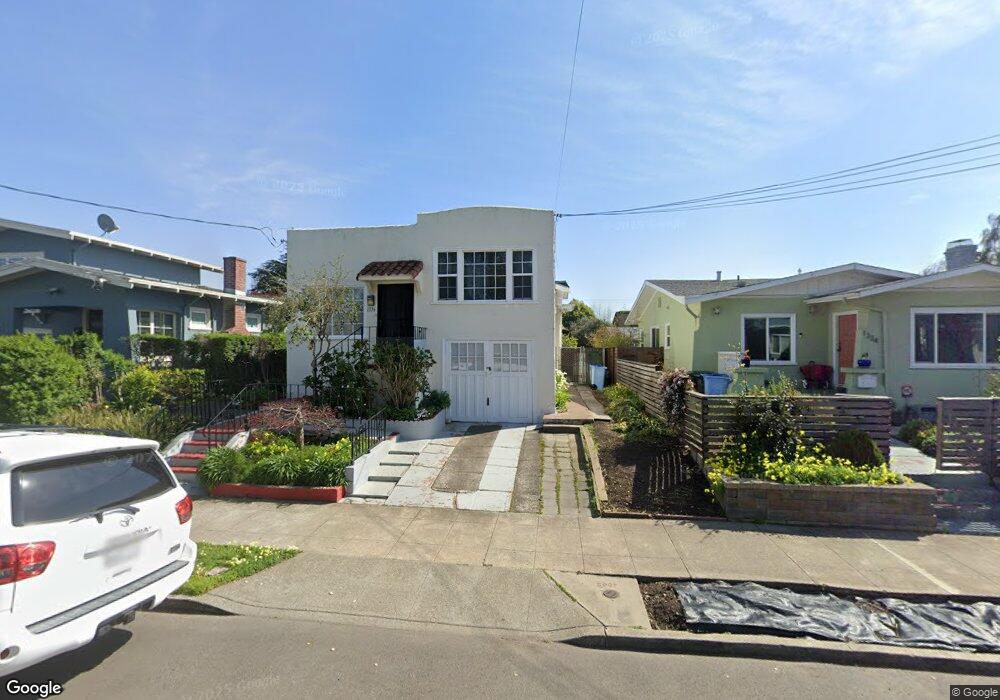
1336 Blake St Berkeley, CA 94702
West Berkeley NeighborhoodEstimated Value: $888,000 - $1,401,000
3
Beds
2
Baths
1,419
Sq Ft
$857/Sq Ft
Est. Value
About This Home
This home is located at 1336 Blake St, Berkeley, CA 94702 and is currently estimated at $1,216,276, approximately $857 per square foot. 1336 Blake St is a home located in Alameda County with nearby schools including Oxford Elementary School, Washington Elementary School, and Malcolm X Elementary School.
Ownership History
Date
Name
Owned For
Owner Type
Purchase Details
Closed on
Nov 19, 2025
Sold by
Chen Meng Jiang and Baoyue Ren Baoyue
Bought by
Meng Family 2025 Trust and Ren
Current Estimated Value
Purchase Details
Closed on
Jul 20, 1994
Sold by
Lara Frank
Bought by
Meng Jiang Chen and Ren Baoyue
Home Financials for this Owner
Home Financials are based on the most recent Mortgage that was taken out on this home.
Original Mortgage
$128,000
Interest Rate
8.25%
Create a Home Valuation Report for This Property
The Home Valuation Report is an in-depth analysis detailing your home's value as well as a comparison with similar homes in the area
Home Values in the Area
Average Home Value in this Area
Purchase History
| Date | Buyer | Sale Price | Title Company |
|---|---|---|---|
| Meng Family 2025 Trust | -- | None Listed On Document | |
| Meng Jiang Chen | $160,000 | Old Republic Title Company | |
| Lara Frank | -- | Old Republic Title Company |
Source: Public Records
Mortgage History
| Date | Status | Borrower | Loan Amount |
|---|---|---|---|
| Previous Owner | Meng Jiang Chen | $128,000 |
Source: Public Records
Tax History
| Year | Tax Paid | Tax Assessment Tax Assessment Total Assessment is a certain percentage of the fair market value that is determined by local assessors to be the total taxable value of land and additions on the property. | Land | Improvement |
|---|---|---|---|---|
| 2025 | $6,457 | $261,737 | $80,621 | $188,116 |
| 2024 | $6,457 | $256,468 | $79,040 | $184,428 |
| 2023 | $6,243 | $258,303 | $77,491 | $180,812 |
| 2022 | $6,546 | $246,240 | $75,972 | $177,268 |
| 2021 | $6,527 | $241,274 | $74,482 | $173,792 |
| 2020 | $6,146 | $245,728 | $73,718 | $172,010 |
| 2019 | $5,846 | $240,911 | $72,273 | $168,638 |
| 2018 | $5,698 | $236,188 | $70,856 | $165,332 |
| 2017 | $5,473 | $231,557 | $69,467 | $162,090 |
| 2016 | $5,223 | $227,018 | $68,105 | $158,913 |
| 2015 | $5,126 | $223,608 | $67,082 | $156,526 |
| 2014 | $4,994 | $219,230 | $65,769 | $153,461 |
Source: Public Records
Map
Nearby Homes
- 1142 Dwight Way
- 1118 Dwight Way
- 1515 Derby St
- 2324 Browning St
- 1450 Ward St
- 2750 Sacramento St
- 2758 Sacramento St
- 1092 Dwight Way
- 2774 Sacramento St
- 1612 Parker St
- 2782 Sacramento St
- 2790 Sacramento St
- 1612 Carleton St
- 1039 Channing Way
- 2751 Wallace St
- 1645 Dwight Way
- 2747 San Pablo Ave Unit 507
- 2231 Byron St
- 2327 10th St Unit 4
- 1530 Stuart St
- 1334 Blake St
- 1340 Blake St
- 1332 Blake St
- 1343 Parker St
- 1328 Blake St
- 1339 Parker St
- 1350 Blake St
- 1333 Parker St
- 1352 Blake St Unit Downstairs
- 1327 Parker St Unit 1327 Parker St Apt A
- 1326 Blake St
- 1345 Parker St
- 1339 Blake St
- 1329 Parker St Unit 1329
- 1345 Blake St
- 1325 Parker St
- 1335 Blake St
- 1331 Blake St
- 1322 Blake St
- 1402 Blake St
Your Personal Tour Guide
Ask me questions while you tour the home.