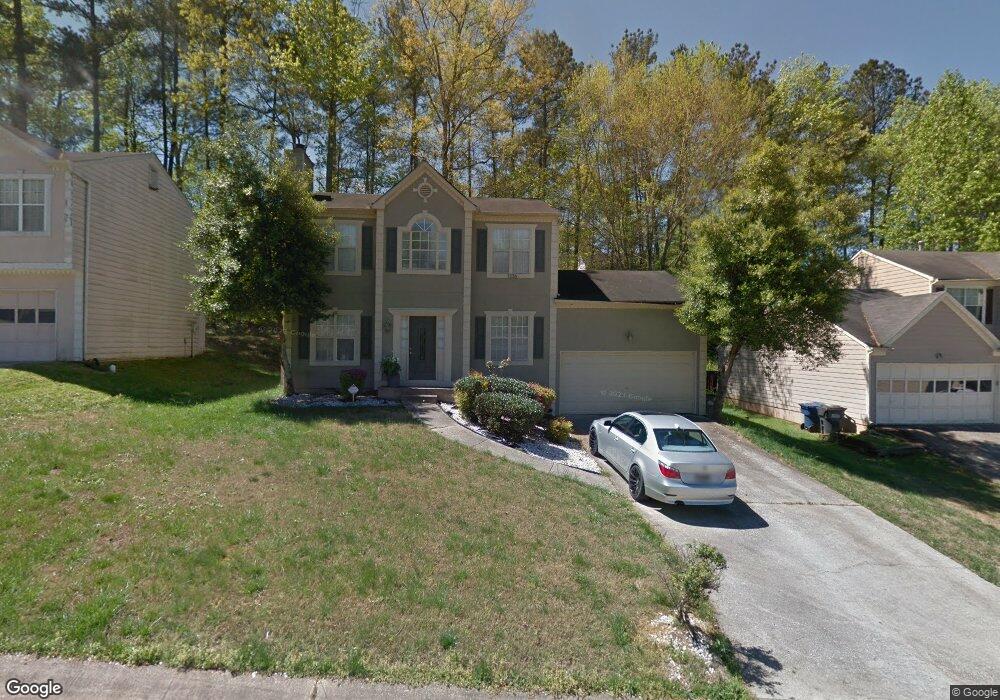
1336 Ling Dr Austell, GA 30168
Estimated Value: $258,000 - $320,449
3
Beds
3
Baths
1,480
Sq Ft
$188/Sq Ft
Est. Value
About This Home
This home is located at 1336 Ling Dr, Austell, GA 30168 and is currently estimated at $278,112, approximately $187 per square foot. 1336 Ling Dr is a home located in Cobb County with nearby schools including Bryant Elementary School, Lindley Middle School, and Pebblebrook High School.
Ownership History
Date
Name
Owned For
Owner Type
Purchase Details
Closed on
Nov 3, 2016
Sold by
Colfin Ai Ga 1 Llc
Bought by
Csh 2016 2 Borrower Llc
Current Estimated Value
Purchase Details
Closed on
Jun 4, 2013
Sold by
Parks Chriscynthia Lyvette
Bought by
Colfin Ai Ga 1 Llc
Purchase Details
Closed on
Dec 14, 2006
Sold by
Secretary Of Hud
Bought by
Parks Chriscynthia L
Home Financials for this Owner
Home Financials are based on the most recent Mortgage that was taken out on this home.
Original Mortgage
$101,200
Interest Rate
6.29%
Mortgage Type
New Conventional
Purchase Details
Closed on
Aug 2, 2005
Sold by
Chase Home Finance Llc
Bought by
Va
Purchase Details
Closed on
Mar 20, 2003
Sold by
Talbert Derrone and Talbert Laurie
Bought by
Thomas Laura
Home Financials for this Owner
Home Financials are based on the most recent Mortgage that was taken out on this home.
Original Mortgage
$127,382
Interest Rate
5.82%
Mortgage Type
FHA
Purchase Details
Closed on
Sep 27, 1996
Sold by
Mccloud Adrienne S
Bought by
Talbert Derrone Laurie
Create a Home Valuation Report for This Property
The Home Valuation Report is an in-depth analysis detailing your home's value as well as a comparison with similar homes in the area
Home Values in the Area
Average Home Value in this Area
Purchase History
| Date | Buyer | Sale Price | Title Company |
|---|---|---|---|
| Csh 2016 2 Borrower Llc | -- | -- | |
| Colfin Ai Ga 1 Llc | $79,500 | -- | |
| Parks Chriscynthia L | -- | -- | |
| Va | -- | -- | |
| Chase Home Finance Llc | $140,280 | -- | |
| Thomas Laura | $131,000 | -- | |
| Talbert Derrone Laurie | $95,500 | -- |
Source: Public Records
Mortgage History
| Date | Status | Borrower | Loan Amount |
|---|---|---|---|
| Previous Owner | Parks Chriscynthia L | $101,200 | |
| Previous Owner | Thomas Laura | $127,382 | |
| Closed | Talbert Derrone Laurie | $0 |
Source: Public Records
Tax History
| Year | Tax Paid | Tax Assessment Tax Assessment Total Assessment is a certain percentage of the fair market value that is determined by local assessors to be the total taxable value of land and additions on the property. | Land | Improvement |
|---|---|---|---|---|
| 2025 | $3,455 | $114,660 | $26,000 | $88,660 |
| 2024 | $2,714 | $90,000 | $16,000 | $74,000 |
| 2023 | $2,714 | $90,000 | $16,000 | $74,000 |
Source: Public Records
Map
Nearby Homes
- 1329 Ling Dr
- 1350 Oak Ridge Rd
- 1163 Park Center Cir
- 1195 Park Center Cir
- 1194 Park Center Cir
- 00 Hembree Ln
- 0 Hembree Ln Unit 10633605
- 1237 Ling Way
- 840 Revena Dr
- 7254 Silverton Trail
- 1395 Ling Dr Unit 2
- 1398 Ling Dr
- 1090 Blair Bridge Rd
- 1334 Ambercrest Way
- 1507 Locust Log Way
- 6854 Panda Ct Unit A
- 6609 Crossing Creek Point
- 1333 Laura Ln
- 6992 Ivy Pointe Row
- 1273 Summerstone Trace
- 1334 Ling Dr
- 7026 Grinder Dr
- 7028 Grinder Dr Unit 2
- 1332 Ling Dr
- 7024 Grinder Dr Unit 2
- 1340 Ling Dr
- 1337 Ling Dr Unit 2
- 7030 Grinder Dr
- 1335 Ling Dr
- 1333 Ling Dr Unit 2
- 7022 Grinder Dr
- 1330 Ling Dr
- 1330 Ling Dr Unit II
- 1330 Ling Dr
- 1339 Ling Dr
- 1342 Ling Dr Unit 2
- 7032 Grinder Dr
- 1331 Ling Dr
- 1341 Ling Dr
- 1328 Ling Dr
Your Personal Tour Guide
Ask me questions while you tour the home.