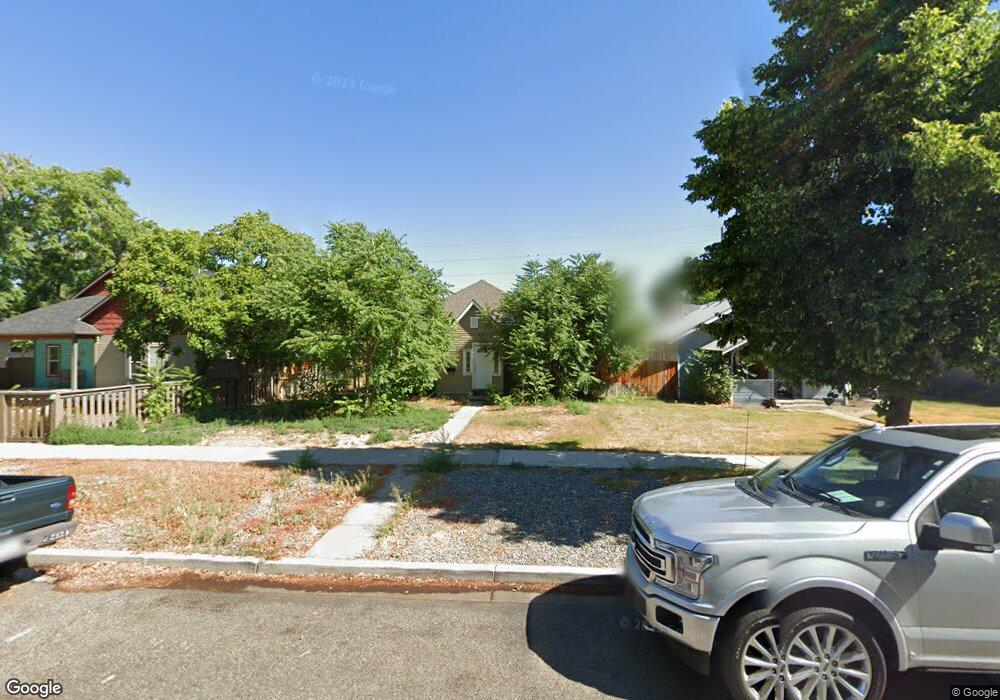
1336 Rood Ave Grand Junction, CO 81501
Downtown Grand Junction NeighborhoodEstimated Value: $308,421 - $336,000
2
Beds
1
Bath
856
Sq Ft
$376/Sq Ft
Est. Value
About This Home
This home is located at 1336 Rood Ave, Grand Junction, CO 81501 and is currently estimated at $321,605, approximately $375 per square foot. 1336 Rood Ave is a home located in Mesa County with nearby schools including Chipeta Elementary School, East Middle School, and West Middle School.
Ownership History
Date
Name
Owned For
Owner Type
Purchase Details
Closed on
Nov 13, 2007
Sold by
R & H Investments Llc
Bought by
Poulton Jasmine B and Wall Greg L
Current Estimated Value
Home Financials for this Owner
Home Financials are based on the most recent Mortgage that was taken out on this home.
Original Mortgage
$163,046
Outstanding Balance
$103,161
Interest Rate
6.38%
Mortgage Type
FHA
Estimated Equity
$218,444
Purchase Details
Closed on
Mar 21, 2007
Sold by
Scotting Ryan and Scotting Heidi
Bought by
R & H Investments Llc
Purchase Details
Closed on
Jan 24, 2007
Sold by
R & H Investments Llc
Bought by
Scotting Ryan and Scotting Heidi
Purchase Details
Closed on
Aug 17, 2006
Sold by
Martinez Arthur V and Martinez Nancy A
Bought by
R & H Investments Llc
Purchase Details
Closed on
Dec 18, 1992
Sold by
Mueller Martha M
Bought by
Wall Greg L
Purchase Details
Closed on
Dec 18, 1989
Sold by
Carie Earl L
Bought by
Wall Greg L
Create a Home Valuation Report for This Property
The Home Valuation Report is an in-depth analysis detailing your home's value as well as a comparison with similar homes in the area
Home Values in the Area
Average Home Value in this Area
Purchase History
| Date | Buyer | Sale Price | Title Company |
|---|---|---|---|
| Poulton Jasmine B | $165,350 | Abstract & Title Company Of | |
| R & H Investments Llc | -- | None Available | |
| Scotting Ryan | -- | None Available | |
| R & H Investments Llc | $75,000 | Abstract & Title Company Of | |
| Wall Greg L | $41,000 | -- | |
| Wall Greg L | $31,900 | -- |
Source: Public Records
Mortgage History
| Date | Status | Borrower | Loan Amount |
|---|---|---|---|
| Open | Poulton Jasmine B | $163,046 |
Source: Public Records
Tax History Compared to Growth
Tax History
| Year | Tax Paid | Tax Assessment Tax Assessment Total Assessment is a certain percentage of the fair market value that is determined by local assessors to be the total taxable value of land and additions on the property. | Land | Improvement |
|---|---|---|---|---|
| 2024 | $1,193 | $16,880 | $4,670 | $12,210 |
| 2023 | $1,193 | $16,880 | $4,670 | $12,210 |
| 2022 | $1,023 | $14,190 | $4,170 | $10,020 |
| 2021 | $1,026 | $14,600 | $4,290 | $10,310 |
| 2020 | $752 | $10,950 | $3,580 | $7,370 |
| 2019 | $711 | $10,950 | $3,580 | $7,370 |
| 2018 | $695 | $9,820 | $3,240 | $6,580 |
| 2017 | $811 | $9,820 | $3,240 | $6,580 |
| 2016 | $607 | $9,680 | $3,380 | $6,300 |
| 2015 | $615 | $9,680 | $3,380 | $6,300 |
| 2014 | $544 | $8,630 | $2,790 | $5,840 |
Source: Public Records
Map
Nearby Homes