Estimated Value: $1,036,799 - $1,472,000
5
Beds
2
Baths
1,945
Sq Ft
$621/Sq Ft
Est. Value
About This Home
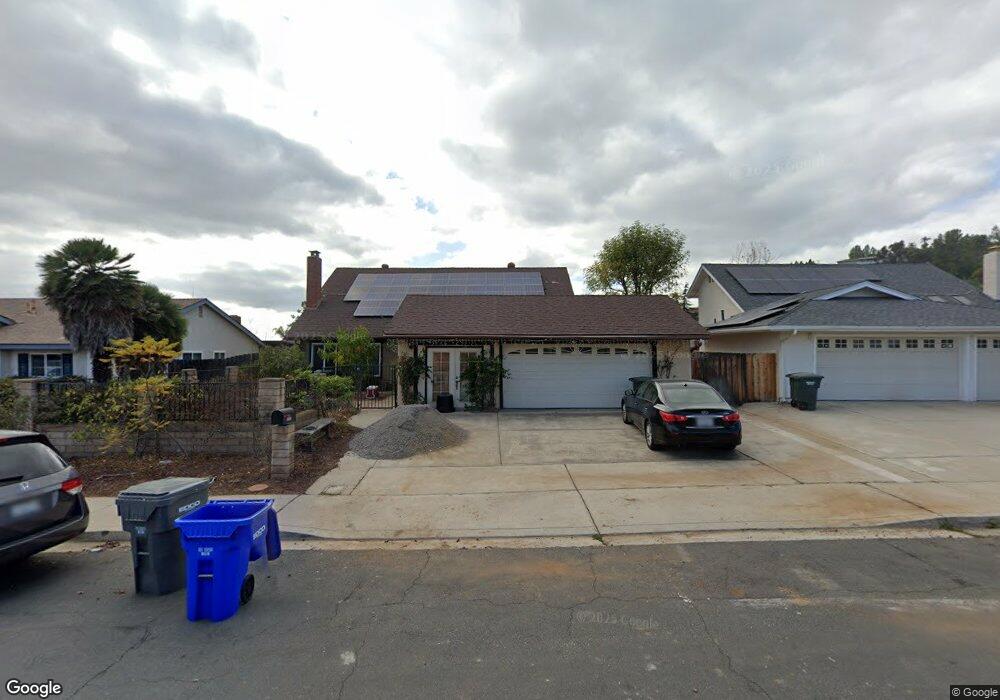
This home is located at 13366 Via Stephen, Poway, CA 92064 and is currently estimated at $1,208,200, approximately $621 per square foot. 13366 Via Stephen is a home located in San Diego County with nearby schools including Garden Road Elementary, Twin Peaks Middle, and Poway High.
Ownership History
Date
Name
Owned For
Owner Type
Purchase Details
Closed on
Jan 29, 2025
Sold by
Gomez Arturo
Bought by
Gracheva Inna
Current Estimated Value
Purchase Details
Closed on
Mar 8, 2022
Sold by
Bennett Keith A and Bennett Inna V
Bought by
Gracheva Inna V
Home Financials for this Owner
Home Financials are based on the most recent Mortgage that was taken out on this home.
Original Mortgage
$501,000
Interest Rate
3.01%
Mortgage Type
New Conventional
Purchase Details
Closed on
Mar 27, 2015
Sold by
Rhea Charles L and Rhea Sandra K
Bought by
Bennett Keith A and Gracheva Inna
Home Financials for this Owner
Home Financials are based on the most recent Mortgage that was taken out on this home.
Original Mortgage
$580,546
Interest Rate
3.8%
Mortgage Type
VA
Purchase Details
Closed on
Jan 30, 2006
Sold by
Rhea Charles L and Rhea Sandra K
Bought by
Rhea Charles L and Rhea Sandra K
Create a Home Valuation Report for This Property
The Home Valuation Report is an in-depth analysis detailing your home's value as well as a comparison with similar homes in the area
Home Values in the Area
Average Home Value in this Area
Purchase History
| Date | Buyer | Sale Price | Title Company |
|---|---|---|---|
| Gracheva Inna | -- | None Listed On Document | |
| Gracheva Inna V | -- | None Listed On Document | |
| Bennett Keith A | $562,000 | Fidelity National Title | |
| Rhea Charles L | -- | None Available |
Source: Public Records
Mortgage History
| Date | Status | Borrower | Loan Amount |
|---|---|---|---|
| Previous Owner | Gracheva Inna V | $501,000 | |
| Previous Owner | Bennett Keith A | $580,546 |
Source: Public Records
Tax History Compared to Growth
Tax History
| Year | Tax Paid | Tax Assessment Tax Assessment Total Assessment is a certain percentage of the fair market value that is determined by local assessors to be the total taxable value of land and additions on the property. | Land | Improvement |
|---|---|---|---|---|
| 2025 | $7,443 | $675,429 | $408,625 | $266,804 |
| 2024 | $7,443 | $662,186 | $400,613 | $261,573 |
| 2023 | $7,285 | $649,203 | $392,758 | $256,445 |
| 2022 | $7,163 | $623,995 | $377,507 | $246,488 |
| 2021 | $7,069 | $623,995 | $377,507 | $246,488 |
| 2020 | $6,974 | $617,598 | $373,637 | $243,961 |
| 2019 | $6,793 | $605,489 | $366,311 | $239,178 |
| 2018 | $6,602 | $593,618 | $359,129 | $234,489 |
| 2017 | $6,425 | $581,980 | $352,088 | $229,892 |
| 2016 | $6,293 | $570,570 | $345,185 | $225,385 |
| 2015 | $1,894 | $163,420 | $56,520 | $106,900 |
| 2014 | $1,851 | $160,219 | $55,413 | $104,806 |
Source: Public Records
Map
Nearby Homes
- 13409 Sutter Mill Rd
- 13255 Evanston Dr
- 13230 Johannesberg Way Unit 10
- 14287 Lolin Ln
- 14513 Mirando St
- 13918 Putney Rd
- 13648 Putney Rd
- 14514 Kennebunk St
- 14550 Dehia St
- 13654 Somerset Rd
- 14543 Kittery St
- 13435 Frey Ct
- 14082 Pomegranate Ave Unit 146
- 13403 Little Dawn Ln
- 13544 Comuna Dr
- 13329 Casa Vista St Unit 98
- 13286 Creek Park Ln
- 14152 Kendra Way
- 13325 Alpine Dr Unit 11
- 13056 Poway Rd
- 13372 Via Stephen
- 13358 Via Stephen
- 13353 Via Mark
- 13343 Via Mark
- 13348 Via Stephen
- 13363 Via Mark
- 13378 Via Stephen
- 13335 Via Mark
- 13371 Via Mark
- 13365 Via Stephen
- 13357 Via Stephen
- 13340 Via Stephen
- 13373 Via Stephen
- 13382 Via Stephen
- 13349 Via Stephen
- 13325 Via Mark
- 13377 Via Mark
- 13379 Via Stephen
- 13341 Via Stephen
- 13332 Via Stephen