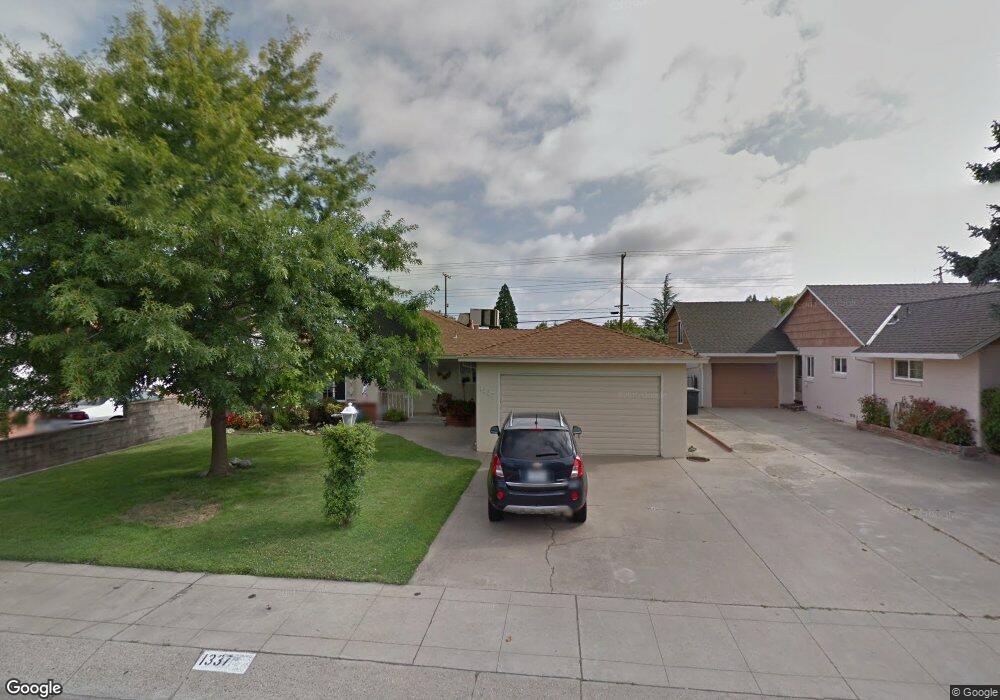
1337 Holly Dr Lodi, CA 95242
North Lodi NeighborhoodEstimated Value: $339,000 - $460,000
3
Beds
2
Baths
1,239
Sq Ft
$329/Sq Ft
Est. Value
About This Home
This home is located at 1337 Holly Dr, Lodi, CA 95242 and is currently estimated at $407,937, approximately $329 per square foot. 1337 Holly Dr is a home located in San Joaquin County with nearby schools including Lakewood Elementary School, Millswood Middle School, and Lodi High School.
Ownership History
Date
Name
Owned For
Owner Type
Purchase Details
Closed on
Nov 3, 2020
Sold by
Miner Gregory Nicholas and Miner Sarah Regina
Bought by
Miner Gregory Nicholas and Miner Sarah Regina
Current Estimated Value
Home Financials for this Owner
Home Financials are based on the most recent Mortgage that was taken out on this home.
Original Mortgage
$140,000
Outstanding Balance
$101,123
Interest Rate
2.8%
Mortgage Type
New Conventional
Estimated Equity
$306,814
Purchase Details
Closed on
Nov 18, 2013
Sold by
Gruber Deb and The Liebelt Revocable Trust
Bought by
Miner Gregory N and Gruber Sarah R
Home Financials for this Owner
Home Financials are based on the most recent Mortgage that was taken out on this home.
Original Mortgage
$104,000
Interest Rate
4.18%
Mortgage Type
New Conventional
Purchase Details
Closed on
Oct 28, 2009
Sold by
Liebelt Lenora
Bought by
Liebelt Lenora and The Liebelt Revocable Trust
Create a Home Valuation Report for This Property
The Home Valuation Report is an in-depth analysis detailing your home's value as well as a comparison with similar homes in the area
Home Values in the Area
Average Home Value in this Area
Purchase History
| Date | Buyer | Sale Price | Title Company |
|---|---|---|---|
| Miner Gregory Nicholas | -- | Chicago Title Company | |
| Miner Gregory N | $130,000 | Chicago Title Company | |
| Liebelt Lenora | -- | None Available |
Source: Public Records
Mortgage History
| Date | Status | Borrower | Loan Amount |
|---|---|---|---|
| Open | Miner Gregory Nicholas | $140,000 | |
| Closed | Miner Gregory N | $104,000 |
Source: Public Records
Tax History
| Year | Tax Paid | Tax Assessment Tax Assessment Total Assessment is a certain percentage of the fair market value that is determined by local assessors to be the total taxable value of land and additions on the property. | Land | Improvement |
|---|---|---|---|---|
| 2025 | $784 | $77,954 | $13,969 | $63,985 |
| 2024 | $762 | $76,427 | $13,696 | $62,731 |
| 2023 | $751 | $74,929 | $13,428 | $61,501 |
| 2022 | $808 | $73,461 | $13,165 | $60,296 |
| 2021 | $823 | $72,021 | $12,907 | $59,114 |
| 2020 | $802 | $71,283 | $12,775 | $58,508 |
| 2019 | $786 | $69,886 | $12,525 | $57,361 |
| 2018 | $775 | $68,517 | $12,280 | $56,237 |
| 2017 | $758 | $67,175 | $12,040 | $55,135 |
| 2016 | $711 | $65,858 | $11,804 | $54,054 |
| 2014 | $696 | $200,000 | $75,000 | $125,000 |
Source: Public Records
Map
Nearby Homes
- 1507 Holly Dr
- 1427 Reiman St
- 507 N Sunset Dr
- 1416 Reiman St
- 527 Cross St
- 418 Gerard Dr
- 400 N Pacific Ave
- 1421 Graffigna Ave
- 1424 Graffigna Ave
- 1413 Mariposa Way
- 1718 Robert St
- 1507 W Locust St
- 909 Greenwood Dr
- 606 W Turner Rd
- 1618 W Locust St
- 610 N California St
- 421 Daisy Ave
- 416 Daisy Ave
- 1786 Le Bec Ct
- 32 S Corinth Ave
Your Personal Tour Guide
Ask me questions while you tour the home.