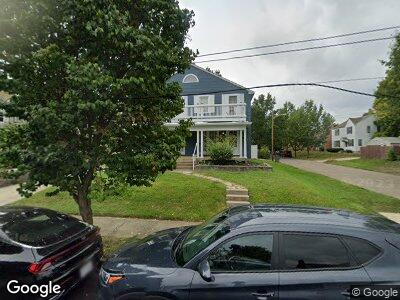
1337 Meadow Rd Unit 339 Columbus, OH 43212
Fifth by Northwest NeighborhoodEstimated Value: $465,757 - $595,000
6
Beds
2
Baths
2,576
Sq Ft
$203/Sq Ft
Est. Value
About This Home
This home is located at 1337 Meadow Rd Unit 339, Columbus, OH 43212 and is currently estimated at $521,689, approximately $202 per square foot. 1337 Meadow Rd Unit 339 is a home located in Franklin County with nearby schools including Cranbrook Elementary School, Ridgeview Middle School, and Centennial High School.
Ownership History
Date
Name
Owned For
Owner Type
Purchase Details
Closed on
Sep 13, 2021
Sold by
Mdmv Properties Llc
Bought by
Vance Shawn
Current Estimated Value
Home Financials for this Owner
Home Financials are based on the most recent Mortgage that was taken out on this home.
Original Mortgage
$307,500
Outstanding Balance
$283,436
Interest Rate
2.8%
Mortgage Type
New Conventional
Estimated Equity
$234,277
Purchase Details
Closed on
Sep 29, 2016
Sold by
Vance Shawn D
Bought by
Mcmv Finance Llc
Purchase Details
Closed on
Mar 22, 2002
Sold by
Elliott Wiley J
Bought by
Vance Shawn D
Home Financials for this Owner
Home Financials are based on the most recent Mortgage that was taken out on this home.
Original Mortgage
$155,700
Interest Rate
6.87%
Mortgage Type
Purchase Money Mortgage
Purchase Details
Closed on
Aug 21, 1992
Bought by
Elliott Wiley J
Purchase Details
Closed on
Oct 1, 1984
Create a Home Valuation Report for This Property
The Home Valuation Report is an in-depth analysis detailing your home's value as well as a comparison with similar homes in the area
Home Values in the Area
Average Home Value in this Area
Purchase History
| Date | Buyer | Sale Price | Title Company |
|---|---|---|---|
| Vance Shawn | $410,000 | None Available | |
| Mcmv Finance Llc | -- | None Available | |
| Vance Shawn D | $173,000 | Chicago Title | |
| Elliott Wiley J | $115,000 | -- | |
| -- | $69,000 | -- |
Source: Public Records
Mortgage History
| Date | Status | Borrower | Loan Amount |
|---|---|---|---|
| Open | Vance Shawn | $307,500 | |
| Previous Owner | Vance Shawn D | $136,708 | |
| Previous Owner | Vance Shawn D | $74,000 | |
| Previous Owner | Vance Shawn D | $52,300 | |
| Previous Owner | Vance Shawn D | $35,000 | |
| Previous Owner | Vance Shawn D | $158,500 | |
| Previous Owner | Vance Shawn D | $155,700 |
Source: Public Records
Tax History Compared to Growth
Tax History
| Year | Tax Paid | Tax Assessment Tax Assessment Total Assessment is a certain percentage of the fair market value that is determined by local assessors to be the total taxable value of land and additions on the property. | Land | Improvement |
|---|---|---|---|---|
| 2024 | $6,352 | $138,610 | $54,290 | $84,320 |
| 2023 | $6,423 | $138,600 | $54,285 | $84,315 |
| 2022 | $6,486 | $119,220 | $26,290 | $92,930 |
| 2021 | $6,347 | $119,220 | $26,290 | $92,930 |
| 2020 | $6,356 | $119,220 | $26,290 | $92,930 |
| 2019 | $5,764 | $92,690 | $26,290 | $66,400 |
| 2018 | $5,112 | $92,690 | $26,290 | $66,400 |
| 2017 | $5,812 | $92,690 | $26,290 | $66,400 |
| 2016 | $4,744 | $69,830 | $24,890 | $44,940 |
| 2015 | $4,319 | $69,830 | $24,890 | $44,940 |
| 2014 | $4,330 | $69,830 | $24,890 | $44,940 |
| 2013 | $2,034 | $66,500 | $23,695 | $42,805 |
Source: Public Records
Map
Nearby Homes
- 1369 Meadow Rd
- 1324 Haines Ave
- 1225 Eastview Ave
- 1422 W 2nd Ave
- 1333 Haines Ave
- 1345 Haines Ave
- 1353 Haines Ave
- 1095 W 3rd Ave
- 1242 Oxley Rd
- 1093 W 3rd Ave
- 1240 Oxley Rd
- 1083 W 3rd Ave
- 1081 W 3rd Ave
- 980 Woodhill Dr
- 1513 W 6th Ave Unit 1513
- 1481 Chesapeake Ave
- 1015 Concord Ave
- 1470 King Ave
- 1476-1506 King Ave Unit 1476
- 947 Thomas Rd
- 1337 Meadow Rd Unit 339
- 1331 Meadow Rd
- 1327 Meadow Rd
- 1349 Meadow Rd
- 1271 Brexton Place Unit 77
- 1271 Brexton Place
- 1353 Meadow Rd
- 1270 Brexton Place Unit 272
- 1332 Meadow Rd
- 1342 Meadow Rd
- 1300 Northwest Blvd Unit 406
- 1300 Northwest Blvd Unit 405
- 1300 Northwest Blvd Unit 404
- 1300 Northwest Blvd Unit 403
- 1300 Northwest Blvd Unit 402
- 1300 Northwest Blvd Unit 401
- 1300 Northwest Blvd Unit 307
- 1300 Northwest Blvd Unit 306
- 1300 Northwest Blvd Unit 305
- 1300 Northwest Blvd Unit 304