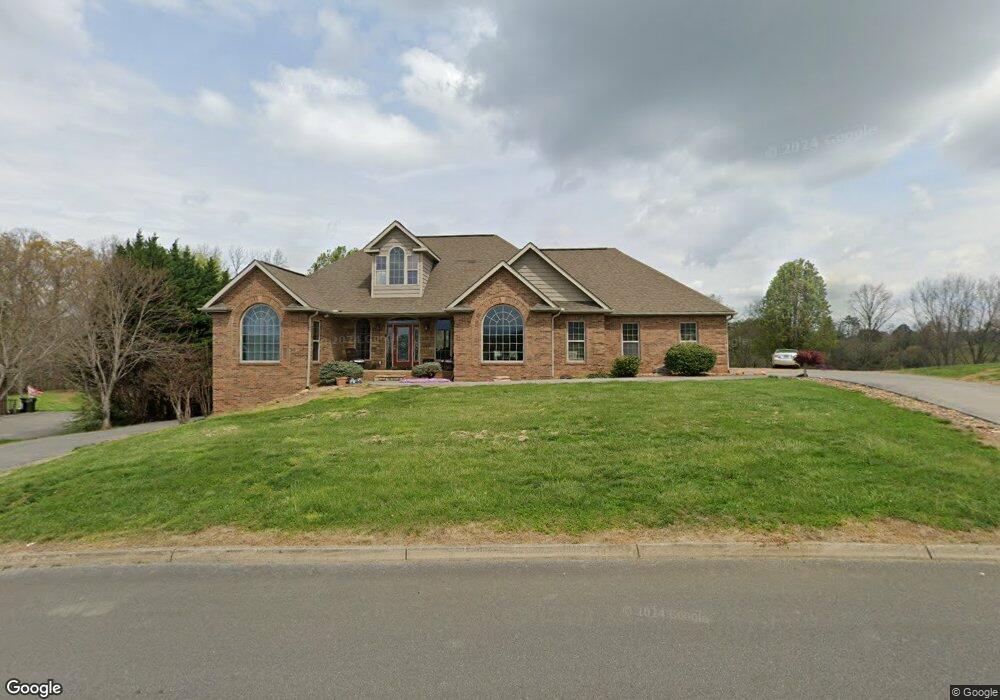
1337 Robert Ridge Rd Sevierville, TN 37862
Estimated Value: $741,540 - $901,000
--
Bed
4
Baths
3,500
Sq Ft
$235/Sq Ft
Est. Value
About This Home
This home is located at 1337 Robert Ridge Rd, Sevierville, TN 37862 and is currently estimated at $821,270, approximately $234 per square foot. 1337 Robert Ridge Rd is a home located in Sevier County with nearby schools including Catons Chapel Elementary School, Northview Elementary School, and Jones Cove Elementary School.
Ownership History
Date
Name
Owned For
Owner Type
Purchase Details
Closed on
Mar 28, 2017
Sold by
Tennessee State Bank
Bought by
Patel Dipen
Current Estimated Value
Home Financials for this Owner
Home Financials are based on the most recent Mortgage that was taken out on this home.
Original Mortgage
$328,944
Outstanding Balance
$253,035
Interest Rate
4.1%
Mortgage Type
New Conventional
Estimated Equity
$568,235
Purchase Details
Closed on
Oct 13, 2016
Sold by
Gillispie Stacy B
Bought by
Tennessee State Bank
Purchase Details
Closed on
Jul 11, 2008
Sold by
Martin Roy G
Bought by
Gillispie Stacy B
Home Financials for this Owner
Home Financials are based on the most recent Mortgage that was taken out on this home.
Original Mortgage
$395,000
Interest Rate
6.27%
Purchase Details
Closed on
Jul 28, 2005
Sold by
Phillipson Joseph C
Bought by
Martin Roy G
Purchase Details
Closed on
Jun 25, 2004
Bought by
Phillipson Joseph C
Create a Home Valuation Report for This Property
The Home Valuation Report is an in-depth analysis detailing your home's value as well as a comparison with similar homes in the area
Home Values in the Area
Average Home Value in this Area
Purchase History
| Date | Buyer | Sale Price | Title Company |
|---|---|---|---|
| Patel Dipen | $365,900 | -- | |
| Tennessee State Bank | $364,210 | -- | |
| Gillispie Stacy B | $468,000 | -- | |
| Martin Roy G | $60,000 | -- | |
| Phillipson Joseph C | $52,300 | -- |
Source: Public Records
Mortgage History
| Date | Status | Borrower | Loan Amount |
|---|---|---|---|
| Closed | Phillipson Joseph C | $0 | |
| Open | Patel Dipen | $328,944 | |
| Previous Owner | Phillipson Joseph C | $395,000 |
Source: Public Records
Tax History Compared to Growth
Tax History
| Year | Tax Paid | Tax Assessment Tax Assessment Total Assessment is a certain percentage of the fair market value that is determined by local assessors to be the total taxable value of land and additions on the property. | Land | Improvement |
|---|---|---|---|---|
| 2025 | $4,066 | $137,350 | $18,000 | $119,350 |
| 2024 | $4,066 | $137,350 | $18,000 | $119,350 |
| 2023 | $4,066 | $137,350 | $0 | $0 |
| 2022 | $2,617 | $137,350 | $18,000 | $119,350 |
| 2021 | $2,617 | $137,350 | $18,000 | $119,350 |
| 2020 | $2,737 | $137,350 | $18,000 | $119,350 |
| 2019 | $2,737 | $116,125 | $16,000 | $100,125 |
| 2018 | $2,737 | $116,125 | $16,000 | $100,125 |
| 2017 | $2,737 | $116,125 | $16,000 | $100,125 |
| 2016 | $2,520 | $116,125 | $16,000 | $100,125 |
| 2015 | -- | $113,875 | $0 | $0 |
| 2014 | $2,209 | $113,875 | $0 | $0 |
Source: Public Records
Map
Nearby Homes
- 1329 Robert Ridge Rd
- 1409 Robert Ridge Rd
- Lot 9 Alum Cave Cove
- 1507 Denton Rd
- 1438 William Holt Blvd
- 1480 William Holt Blvd
- 1311 Ina Grace Ln
- 1709 Willow Trace Ct
- 1424 William Holt Blvd
- 1266 Sunrise Dr
- 1208 Jenna Ct
- 1350 Snappwood Dr
- 1835 Sunnydale Dr
- 1126 Smokyview Dr
- 1825 Newman Town Rd
- 1315 Sunrise Dr
- 1339 Flatwood Rd
- 1465 Landmark Blvd
- 1623 McKinley View Blvd
- 1409 Katie Ln
- 1343 Robert Ridge Rd
- 1333 Robert Ridge Rd
- 1334 Robert Ridge Rd
- 1342 Robert Ridge Rd
- 1349 Robert Ridge Rd
- 1348 Robert Ridge Rd
- 1326 Robert Ridge Rd
- 1355 Robert Ridge Rd
- 1352 Robert Ridge Rd
- 1327 Ellendale Cove
- 1323 Ellendale Cove
- 1315 Robert Ridge Rd
- 1320 Robert Ridge Rd
- 0 Robert Ridge Rd Unit 228441
- 0 Robert Ridge Rd Unit 222197
- 0 Robert Ridge Rd Unit 640734
- 0 Robert Ridge Rd Unit 845368
- 0 Robert Ridge Rd Unit 925970
- 0 Robert Ridge Rd Unit 933325
- 0 Robert Ridge Rd Unit 951949