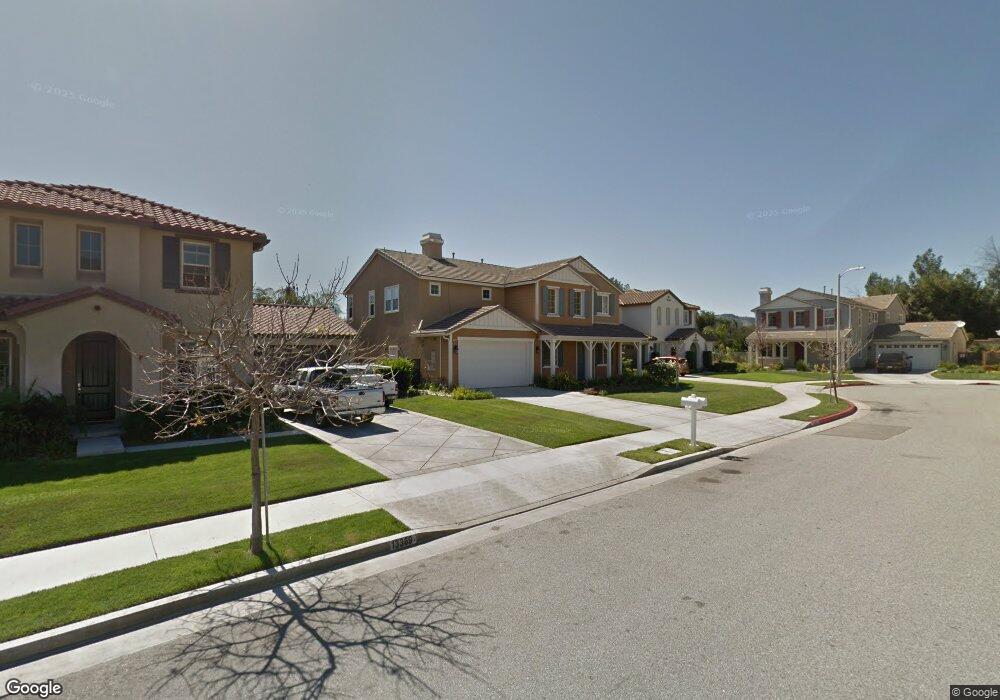
13373 Los Olivos Rd Sylmar, CA 91342
Estimated Value: $1,084,000 - $1,227,000
4
Beds
4
Baths
3,175
Sq Ft
$364/Sq Ft
Est. Value
About This Home
This home is located at 13373 Los Olivos Rd, Sylmar, CA 91342 and is currently estimated at $1,156,800, approximately $364 per square foot. 13373 Los Olivos Rd is a home located in Los Angeles County with nearby schools including Herrick Avenue Elementary School, Olive Vista Middle School, and San Fernando Senior High School.
Ownership History
Date
Name
Owned For
Owner Type
Purchase Details
Closed on
Nov 24, 2012
Sold by
Vanphan An Van and An Van Phan #586-10
Bought by
Vanphan An Van and Duong Ha Thu
Current Estimated Value
Purchase Details
Closed on
Nov 11, 2008
Sold by
Lasalle Bank National Association
Bought by
Vanphan An
Purchase Details
Closed on
Aug 26, 2008
Sold by
Bonilla Cristina I
Bought by
Lasalle Bank Na and First Franklin Mortgage Loan Trust 2007-
Purchase Details
Closed on
Nov 22, 2006
Sold by
Wl Homes Llc
Bought by
Bonilla Cristina I
Home Financials for this Owner
Home Financials are based on the most recent Mortgage that was taken out on this home.
Original Mortgage
$147,950
Interest Rate
6.22%
Mortgage Type
Stand Alone Second
Create a Home Valuation Report for This Property
The Home Valuation Report is an in-depth analysis detailing your home's value as well as a comparison with similar homes in the area
Home Values in the Area
Average Home Value in this Area
Purchase History
| Date | Buyer | Sale Price | Title Company |
|---|---|---|---|
| Vanphan An Van | -- | None Available | |
| Vanphan An | $425,000 | Lawyers Title | |
| Lasalle Bank Na | $441,840 | Accommodation | |
| Bonilla Cristina I | $740,000 | First American Title Co | |
| Bonilla Cristina I | -- | First American Title Co |
Source: Public Records
Mortgage History
| Date | Status | Borrower | Loan Amount |
|---|---|---|---|
| Previous Owner | Bonilla Cristina I | $147,950 | |
| Previous Owner | Bonilla Cristina I | $591,700 |
Source: Public Records
Tax History Compared to Growth
Tax History
| Year | Tax Paid | Tax Assessment Tax Assessment Total Assessment is a certain percentage of the fair market value that is determined by local assessors to be the total taxable value of land and additions on the property. | Land | Improvement |
|---|---|---|---|---|
| 2025 | $6,863 | $547,283 | $189,293 | $357,990 |
| 2024 | $6,863 | $536,553 | $185,582 | $350,971 |
| 2023 | $6,732 | $526,034 | $181,944 | $344,090 |
| 2022 | $6,422 | $515,721 | $178,377 | $337,344 |
| 2021 | $6,325 | $505,610 | $174,880 | $330,730 |
| 2020 | $6,380 | $500,426 | $173,087 | $327,339 |
| 2019 | $6,135 | $490,615 | $169,694 | $320,921 |
| 2018 | $6,029 | $480,996 | $166,367 | $314,629 |
| 2016 | $5,732 | $462,319 | $159,907 | $302,412 |
| 2015 | $5,649 | $455,376 | $157,506 | $297,870 |
| 2014 | $5,671 | $446,457 | $154,421 | $292,036 |
Source: Public Records
Map
Nearby Homes
- 13346 Los Olivos Rd
- 15185 Cobalt St
- 15831 Olden St Unit 63
- 15245 Monte St
- 13775 Glenoaks Blvd Unit 16
- 13522 Glenoaks Blvd Unit 4
- 15122 Roxford St Unit 7
- 15574 Sorbonne St
- 15766 Roxford St
- 13800 Glenoaks Blvd
- 13120 Bradley Ave Unit 43
- 13120 Bradley Ave Unit 44
- 15232 Foothill Blvd Unit 111
- 15915 Foothill Blvd
- 13531 Fusano Ave
- 12925 El Dorado Ave
- 12917 El Dorado Ave
- 16079 Yarnell St Unit B18
- 14923 La Valle St
- 15721 Cobalt St Unit 118
- 13369 Los Olivos Rd
- 13377 Los Olivos Rd
- 13365 Los Olivos Rd
- 13381 Los Olivos Rd
- 13361 Los Olivos Rd
- 13374 Los Olivos Rd
- 13370 Los Olivos Rd
- 13386 Los Olivos Rd
- 13378 Los Olivos Rd
- 13366 Los Olivos Rd
- 13357 Los Olivos Rd
- 13382 Los Olivos Rd
- 13362 Los Olivos Rd
- 13353 Los Olivos Rd
- 13358 Los Olivos Rd
- 13356 Bradley Ave
- 15536 Monte St
- 13360 Bradley Ave
- 13425 Glenwood Dr
- 13354 Los Olivos Rd