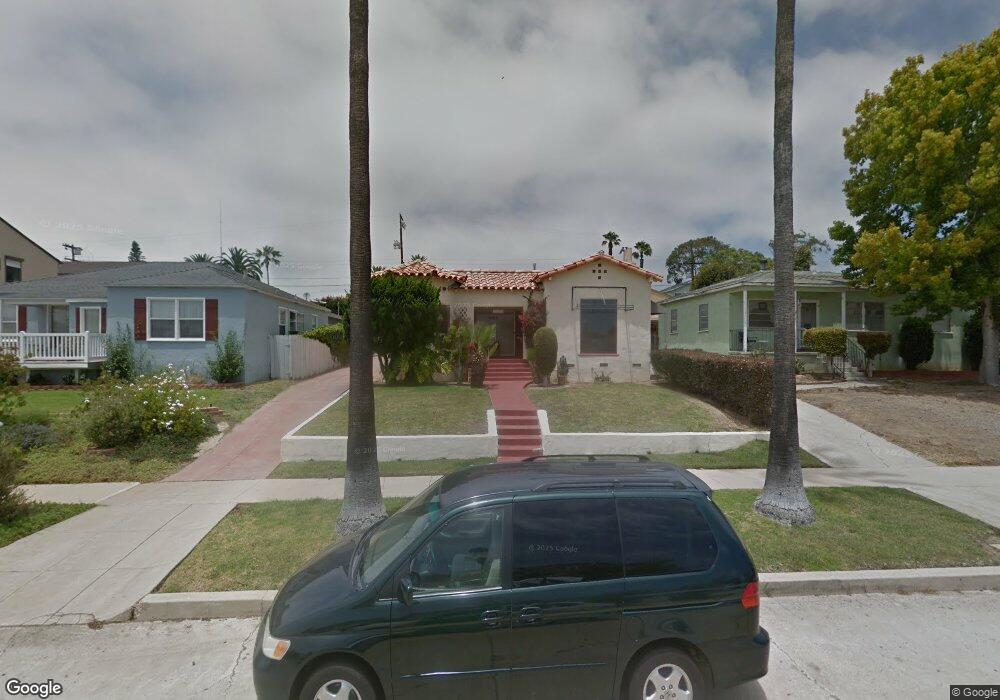
1338 Beryl St San Diego, CA 92109
Pacific Beach NeighborhoodEstimated Value: $1,775,993 - $2,011,000
3
Beds
2
Baths
1,546
Sq Ft
$1,235/Sq Ft
Est. Value
About This Home
This home is located at 1338 Beryl St, San Diego, CA 92109 and is currently estimated at $1,908,998, approximately $1,234 per square foot. 1338 Beryl St is a home located in San Diego County with nearby schools including Pacific Beach Elementary School, Pacific Beach Middle, and Mission Bay High School.
Ownership History
Date
Name
Owned For
Owner Type
Purchase Details
Closed on
Apr 6, 1999
Sold by
Browne Timothy J
Bought by
Browne Timothy J
Current Estimated Value
Home Financials for this Owner
Home Financials are based on the most recent Mortgage that was taken out on this home.
Original Mortgage
$182,000
Outstanding Balance
$45,128
Interest Rate
6.79%
Estimated Equity
$1,863,870
Purchase Details
Closed on
Apr 5, 1999
Sold by
Browne Timothy J
Bought by
Browne Timothy J
Home Financials for this Owner
Home Financials are based on the most recent Mortgage that was taken out on this home.
Original Mortgage
$182,000
Outstanding Balance
$45,128
Interest Rate
6.79%
Estimated Equity
$1,863,870
Purchase Details
Closed on
Aug 29, 1995
Sold by
Browne Debra A
Bought by
Browne Timothy J
Home Financials for this Owner
Home Financials are based on the most recent Mortgage that was taken out on this home.
Original Mortgage
$185,000
Interest Rate
7.83%
Purchase Details
Closed on
May 1, 1987
Purchase Details
Closed on
Mar 1, 1984
Create a Home Valuation Report for This Property
The Home Valuation Report is an in-depth analysis detailing your home's value as well as a comparison with similar homes in the area
Home Values in the Area
Average Home Value in this Area
Purchase History
| Date | Buyer | Sale Price | Title Company |
|---|---|---|---|
| Browne Timothy J | -- | -- | |
| Browne Timothy J | -- | Fidelity National Title Co | |
| Browne Timothy J | -- | Lawyers Title | |
| -- | $214,000 | -- | |
| -- | $135,000 | -- |
Source: Public Records
Mortgage History
| Date | Status | Borrower | Loan Amount |
|---|---|---|---|
| Open | Browne Timothy J | $182,000 | |
| Closed | Browne Timothy J | $185,000 |
Source: Public Records
Tax History Compared to Growth
Tax History
| Year | Tax Paid | Tax Assessment Tax Assessment Total Assessment is a certain percentage of the fair market value that is determined by local assessors to be the total taxable value of land and additions on the property. | Land | Improvement |
|---|---|---|---|---|
| 2025 | $5,005 | $417,769 | $288,125 | $129,644 |
| 2024 | $5,005 | $409,578 | $282,476 | $127,102 |
| 2023 | $4,891 | $401,548 | $276,938 | $124,610 |
| 2022 | $4,760 | $393,675 | $271,508 | $122,167 |
| 2021 | $4,724 | $385,957 | $266,185 | $119,772 |
| 2020 | $4,666 | $382,000 | $263,456 | $118,544 |
| 2019 | $4,582 | $374,511 | $258,291 | $116,220 |
| 2018 | $4,284 | $367,169 | $253,227 | $113,942 |
| 2017 | $4,180 | $359,970 | $248,262 | $111,708 |
| 2016 | $4,111 | $352,913 | $243,395 | $109,518 |
| 2015 | $4,049 | $347,612 | $239,739 | $107,873 |
| 2014 | $3,985 | $340,803 | $235,043 | $105,760 |
Source: Public Records
Map
Nearby Homes
- 1505 Loring St
- 1270 Emerald St
- 1025 Wilbur Ave
- 1220 Emerald St
- 4733 Ingraham St
- 1154 Sapphire St
- 5209 Foothill Blvd
- 1712 Beryl St
- 4944 Cass St Unit 604
- 4944 Cass St Unit 407
- 1361 Felspar St Unit 7
- 1148 Turquoise St
- 1737 Beryl St
- 938 Opal St
- 4964 Kendall St
- 1059 Agate St Unit A
- 972 Sapphire St Unit LA1
- 974 Sapphire St Unit LA2
- 1645 Los Altos Rd
- 976 Sapphire St Unit LA3