134 3rd Ave Cranston, RI 02910
Park View NeighborhoodEstimated Value: $566,000 - $570,000
6
Beds
3
Baths
3,240
Sq Ft
$175/Sq Ft
Est. Value
About This Home
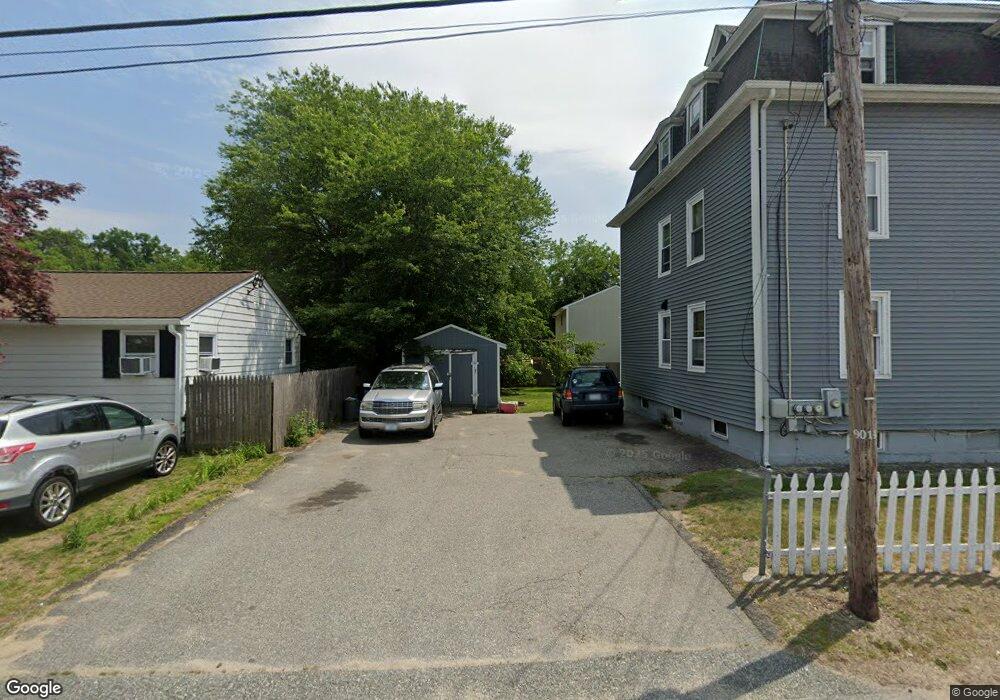
This home is located at 134 3rd Ave, Cranston, RI 02910 and is currently estimated at $568,000, approximately $175 per square foot. 134 3rd Ave is a home located in Providence County with nearby schools including Edgewood Highland Elementary School, Edward S. Rhodes School, and Park View Middle School.
Ownership History
Date
Name
Owned For
Owner Type
Purchase Details
Closed on
May 19, 2016
Sold by
Zenith 3Rd Llc
Bought by
Jordan Conrad V
Current Estimated Value
Purchase Details
Closed on
Aug 13, 2015
Sold by
Murray Steven
Bought by
Birdsong Assoc
Purchase Details
Closed on
Aug 11, 2011
Sold by
Zenith 3Rd Llc
Bought by
Title Invst 2 Rigp
Create a Home Valuation Report for This Property
The Home Valuation Report is an in-depth analysis detailing your home's value as well as a comparison with similar homes in the area
Home Values in the Area
Average Home Value in this Area
Purchase History
| Date | Buyer | Sale Price | Title Company |
|---|---|---|---|
| Jordan Conrad V | -- | -- | |
| Birdsong Assoc | -- | -- | |
| Title Invst 2 Rigp | $1,513 | -- |
Source: Public Records
Mortgage History
| Date | Status | Borrower | Loan Amount |
|---|---|---|---|
| Previous Owner | Title Invst 2 Rigp | $152,000 |
Source: Public Records
Tax History
| Year | Tax Paid | Tax Assessment Tax Assessment Total Assessment is a certain percentage of the fair market value that is determined by local assessors to be the total taxable value of land and additions on the property. | Land | Improvement |
|---|---|---|---|---|
| 2025 | $6,661 | $479,900 | $94,300 | $385,600 |
| 2024 | $6,531 | $479,900 | $94,300 | $385,600 |
| 2023 | $5,628 | $297,800 | $65,100 | $232,700 |
| 2022 | $5,512 | $297,800 | $65,100 | $232,700 |
| 2021 | $5,360 | $297,800 | $65,100 | $232,700 |
| 2020 | $5,249 | $252,700 | $61,800 | $190,900 |
| 2019 | $5,249 | $252,700 | $61,800 | $190,900 |
| 2018 | $4,784 | $235,800 | $61,800 | $174,000 |
| 2017 | $4,219 | $183,900 | $45,500 | $138,400 |
| 2016 | $4,129 | $183,900 | $45,500 | $138,400 |
| 2015 | $4,129 | $183,900 | $45,500 | $138,400 |
| 2014 | $3,787 | $165,800 | $45,500 | $120,300 |
Source: Public Records
Map
Nearby Homes
- 129 1st Ave
- 65 Perkins Ave
- 25 Sharon St Unit 2
- 10 Woburn St
- 0 Elmwood Ave
- 123 Harrington Ave
- 127 Sherwood Ave
- 111 Sherwood Ave
- 171 Sherwood Ave
- 136 Sherwood Ave
- 120 Sherwood Ave
- 103 Harper Ave
- 150 Riverside Ave
- 1320 Elmwood Ave
- 80 George St
- 1302 Elmwood Ave
- 25 Newfield Ave
- 167 Forest Ave
- 94 Holmes Rd
- 10 Dale Ave
Your Personal Tour Guide
Ask me questions while you tour the home.