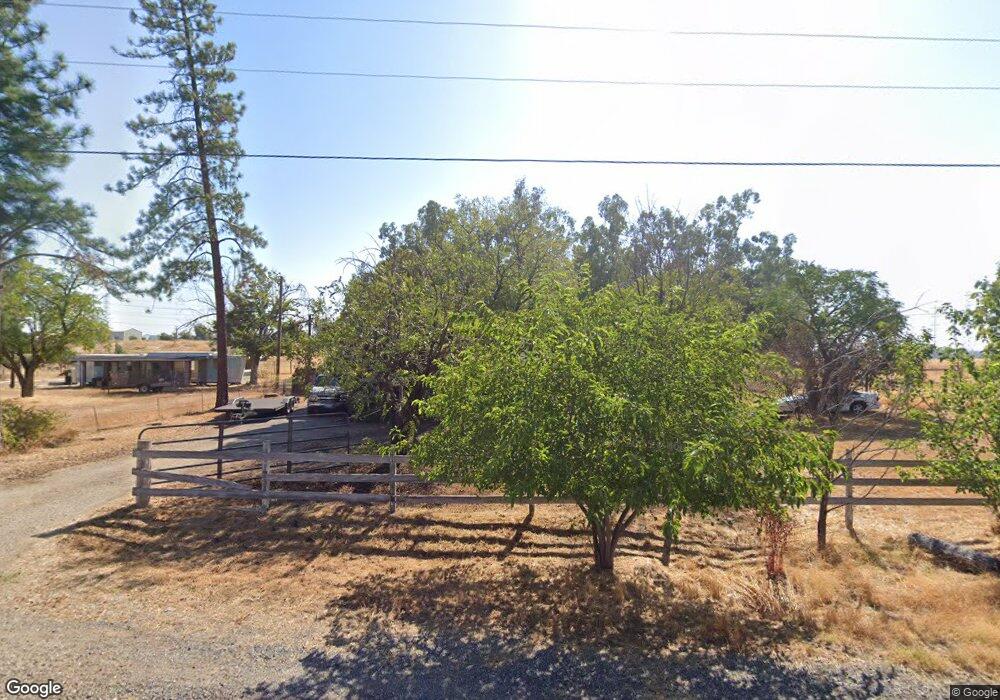
13400 Prairie Ln Red Bluff, CA 96080
Estimated Value: $148,000 - $189,000
2
Beds
1
Bath
683
Sq Ft
$250/Sq Ft
Est. Value
About This Home
This home is located at 13400 Prairie Ln, Red Bluff, CA 96080 and is currently estimated at $171,032, approximately $250 per square foot. 13400 Prairie Ln is a home located in Tehama County with nearby schools including Jackson Heights Elementary School, Vista Preparatory Academy, and Red Bluff High School.
Ownership History
Date
Name
Owned For
Owner Type
Purchase Details
Closed on
Dec 18, 2024
Sold by
Audino Audra and Burris John
Bought by
Hill Ryan and Hill Sunshyne
Current Estimated Value
Home Financials for this Owner
Home Financials are based on the most recent Mortgage that was taken out on this home.
Original Mortgage
$204,880
Outstanding Balance
$203,275
Interest Rate
6.81%
Mortgage Type
FHA
Estimated Equity
-$32,243
Purchase Details
Closed on
Jul 22, 2008
Sold by
Durden Eric
Bought by
Burris James
Home Financials for this Owner
Home Financials are based on the most recent Mortgage that was taken out on this home.
Original Mortgage
$50,000
Interest Rate
6.31%
Mortgage Type
Unknown
Purchase Details
Closed on
Apr 4, 2001
Sold by
Ewoldt Patricia J
Bought by
Durden Eric
Home Financials for this Owner
Home Financials are based on the most recent Mortgage that was taken out on this home.
Original Mortgage
$63,200
Interest Rate
7.19%
Create a Home Valuation Report for This Property
The Home Valuation Report is an in-depth analysis detailing your home's value as well as a comparison with similar homes in the area
Purchase History
| Date | Buyer | Sale Price | Title Company |
|---|---|---|---|
| Hill Ryan | $152,000 | Placer Title | |
| Burris James | $150,000 | Fidelity Natl Title Co Of Ca | |
| Durden Eric | $79,000 | Chicago Title Co |
Source: Public Records
Mortgage History
| Date | Status | Borrower | Loan Amount |
|---|---|---|---|
| Open | Hill Ryan | $204,880 | |
| Previous Owner | Burris James | $50,000 | |
| Previous Owner | Durden Eric | $63,200 |
Source: Public Records
Tax History
| Year | Tax Paid | Tax Assessment Tax Assessment Total Assessment is a certain percentage of the fair market value that is determined by local assessors to be the total taxable value of land and additions on the property. | Land | Improvement |
|---|---|---|---|---|
| 2025 | $1,536 | $150,858 | $67,626 | $83,232 |
| 2023 | $1,489 | $143,000 | $66,000 | $77,000 |
| 2022 | $1,509 | $143,000 | $66,000 | $77,000 |
| 2021 | $1,344 | $130,000 | $60,000 | $70,000 |
| 2020 | $1,880 | $176,621 | $117,748 | $58,873 |
| 2019 | $1,832 | $167,658 | $111,772 | $55,886 |
| 2018 | $1,571 | $152,416 | $101,611 | $50,805 |
| 2017 | $1,471 | $138,560 | $92,374 | $46,186 |
| 2016 | $1,335 | $131,962 | $87,975 | $43,987 |
| 2015 | $1,334 | $131,962 | $87,975 | $43,987 |
| 2014 | $1,167 | $114,750 | $76,500 | $38,250 |
Source: Public Records
Map
Nearby Homes
- 0 Ludlow Ave Unit SN25045951
- 1835 Douglass St
- 1720 Luning St
- 1710 Luning St
- Lot D Aloe Place
- 1715 Walbridge St
- 1707 Luning St
- 1570 Douglass St
- 1500 Walbridge St
- 1356 Park Ave
- 1359 2nd St
- 685 Larie Ln
- 675 Larie Ln
- 12890 Ivy Ln
- 0 Derby Unit 24724349
- 12915 Gardenia Ave
- 1549 Jackson St
- 1426 Lincoln St
- 920 Dumosa Dr
- 106 Treasure Dr
- 13410 Prairie Ln
- 13422 Prairie Ln
- 13423 Prairie Ln
- 13420 Prairie Ln
- 0 Stoll Rd Unit 201140927
- 13440 Prairie Rd
- 20680 Stoll Rd
- 13450 Prairie Ln
- 13443 Prairie Ln
- 20580 Stoll Rd
- 20560 Stoll Rd
- 13445 Baker Rd
- 13455 Baker Rd
- 20640 Estel Ln
- 20520 Stoll Rd
- 20567 Stoll Rd
- 13479 Baker Rd
- 13495 Prairie Ln
- 20645 Estel Ln Unit 20647 ESTEL LANE
- 20645 Estel Ln
Your Personal Tour Guide
Ask me questions while you tour the home.