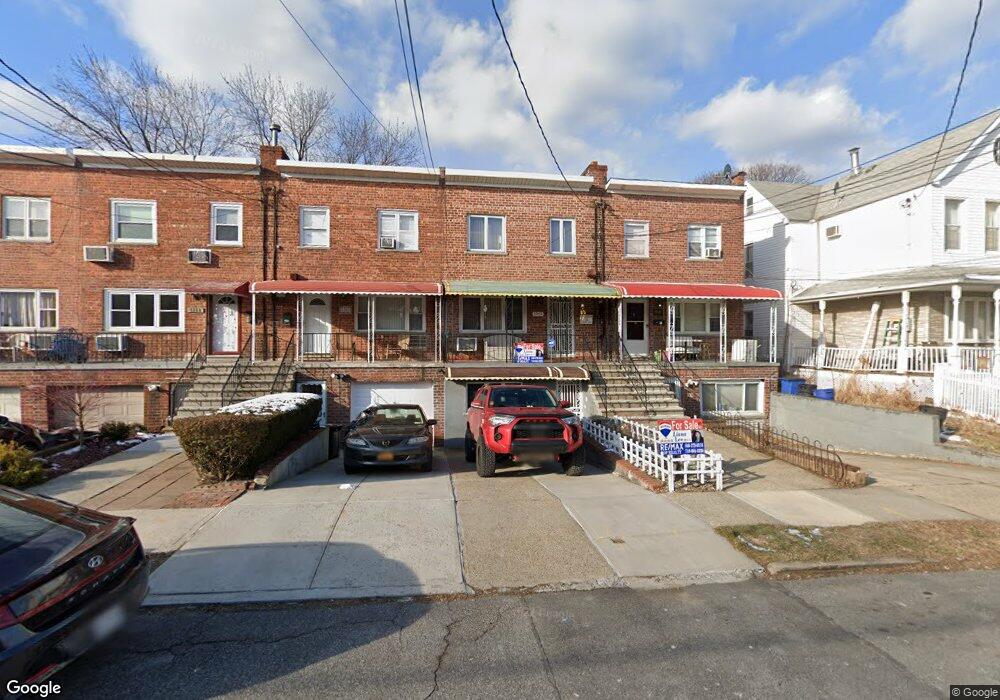
1343 Balcom Ave Bronx, NY 10461
Schuylerville NeighborhoodEstimated Value: $684,000 - $799,000
3
Beds
2
Baths
1,800
Sq Ft
$404/Sq Ft
Est. Value
About This Home
This home is located at 1343 Balcom Ave, Bronx, NY 10461 and is currently estimated at $727,174, approximately $403 per square foot. 1343 Balcom Ave is a home located in Bronx County with nearby schools including P.S. 71 Rose E Scala, Herbert H Lehman High School, and St Benedict School.
Ownership History
Date
Name
Owned For
Owner Type
Purchase Details
Closed on
Mar 27, 2023
Sold by
Negrin Omar A and Son Lusille Q
Bought by
Pipitone Joseph and Son-Pipitone Lusille Q
Current Estimated Value
Purchase Details
Closed on
Mar 18, 2020
Sold by
Negrin Florentina Q
Bought by
Negrin Omar A and Son Lusille Q
Home Financials for this Owner
Home Financials are based on the most recent Mortgage that was taken out on this home.
Original Mortgage
$193,751
Outstanding Balance
$170,893
Interest Rate
3.4%
Mortgage Type
New Conventional
Estimated Equity
$556,281
Purchase Details
Closed on
Jun 7, 2005
Sold by
Negrin Angel and Negrin Florentina Q
Bought by
Negrin Florentina Q
Create a Home Valuation Report for This Property
The Home Valuation Report is an in-depth analysis detailing your home's value as well as a comparison with similar homes in the area
Home Values in the Area
Average Home Value in this Area
Purchase History
| Date | Buyer | Sale Price | Title Company |
|---|---|---|---|
| Pipitone Joseph | -- | -- | |
| Pipitone Joseph | -- | -- | |
| Negrin Omar A | $499,000 | -- | |
| Negrin Omar A | $499,000 | -- | |
| Negrin Florentina Q | -- | -- | |
| Negrin Florentina Q | -- | -- |
Source: Public Records
Mortgage History
| Date | Status | Borrower | Loan Amount |
|---|---|---|---|
| Open | Negrin Omar A | $193,751 | |
| Closed | Negrin Omar A | $193,751 |
Source: Public Records
Tax History
| Year | Tax Paid | Tax Assessment Tax Assessment Total Assessment is a certain percentage of the fair market value that is determined by local assessors to be the total taxable value of land and additions on the property. | Land | Improvement |
|---|---|---|---|---|
| 2025 | $6,178 | $30,758 | $7,061 | $23,697 |
| 2024 | $6,178 | $30,758 | $7,083 | $23,675 |
| 2023 | $6,106 | $30,067 | $7,024 | $23,043 |
| 2022 | $5,749 | $33,720 | $8,760 | $24,960 |
| 2021 | $5,718 | $35,400 | $8,760 | $26,640 |
| 2020 | $3,832 | $33,900 | $8,760 | $25,140 |
| 2019 | $5,069 | $30,780 | $8,760 | $22,020 |
| 2018 | $4,810 | $25,056 | $6,928 | $18,128 |
| 2017 | $4,593 | $23,999 | $8,129 | $15,870 |
| 2016 | $4,216 | $22,641 | $8,368 | $14,273 |
| 2015 | $2,557 | $21,360 | $9,720 | $11,640 |
| 2014 | $2,557 | $21,360 | $9,720 | $11,640 |
Source: Public Records
Map
Nearby Homes
- 1315 Edwards Ave
- 1448 Edwards Ave
- 2819 Coddington Ave
- 2832 Dudley Ave
- 1318 Mayflower Ave
- 1465 Mayflower Ave
- 2877 Waterbury Ave
- 2806 Wellman Ave
- 2888 Wellman Ave
- 1276 Edison Ave Unit A
- 1451 Cornell Place
- 2867 Zulette Ave
- 2871 Zulette Ave
- 1259 Crosby Ave
- 2932 Baisley Ave
- 1292 Crosby Ave
- 1235 Crosby Ave
- 2873 Roebling Ave
- 1271 Hobart Ave
- 2356 Waterbury Ave
- 1345 Balcom Ave
- 1345 Balcom Ave Unit 2
- 1347 Balcom Ave
- 1341 Balcom Ave
- 1339 Balcom Ave
- 1337 Balcom Ave
- 1335 Balcom Ave
- 1355 Balcom Ave
- 1336 Vreeland Ave
- 1334 Vreeland Ave
- 1332 Vreeland Ave
- 1330 Vreeland Ave
- 1333 Balcom Ave
- 1333 Balcom Ave Unit 2S
- 1344 Balcom Ave
- 1344 Balcom Ave Unit First
- 1344 Balcom Ave Unit Ground Floor
- 1328 Vreeland Ave
- 1357 Balcom Ave
- 1342 Balcom Ave
Your Personal Tour Guide
Ask me questions while you tour the home.