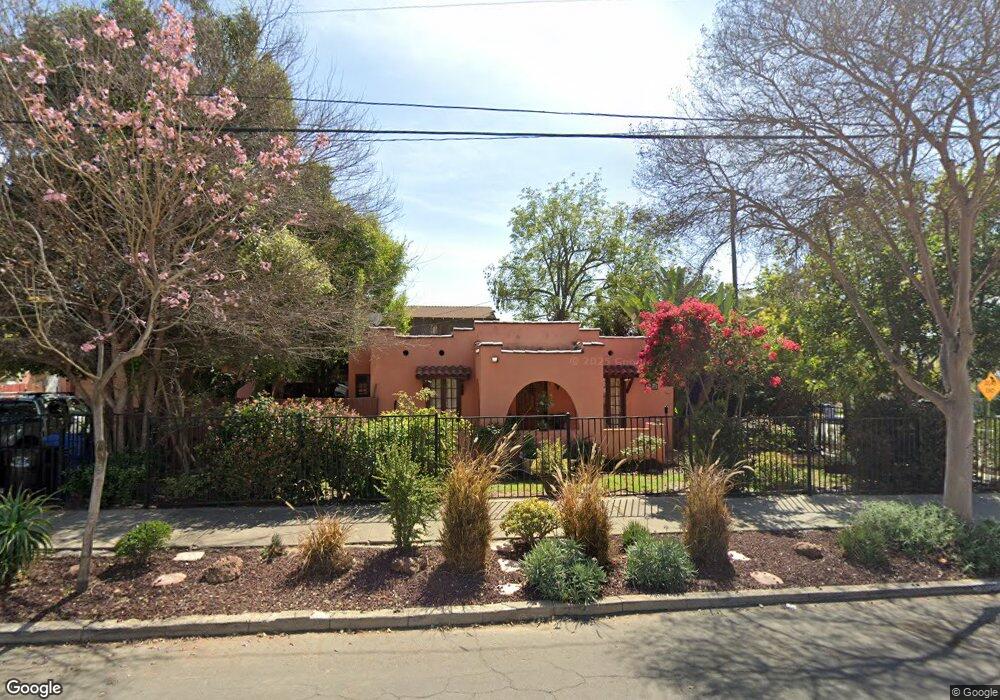
13436 Broadway Whittier, CA 90601
Hadley Hills NeighborhoodEstimated Value: $645,000 - $806,000
2
Beds
1
Bath
936
Sq Ft
$771/Sq Ft
Est. Value
About This Home
This home is located at 13436 Broadway, Whittier, CA 90601 and is currently estimated at $721,368, approximately $770 per square foot. 13436 Broadway is a home located in Los Angeles County with nearby schools including Lou Henry Hoover Elementary School, Walter F. Dexter Middle School, and Whittier High School.
Ownership History
Date
Name
Owned For
Owner Type
Purchase Details
Closed on
Aug 22, 2013
Sold by
Lovera Pamala Sue
Bought by
Lovera Pamala Sue and Lovera Carlos Ruben
Current Estimated Value
Purchase Details
Closed on
Aug 24, 2011
Sold by
Lovera Carlos Ruben
Bought by
Lovera Pamala Sue
Home Financials for this Owner
Home Financials are based on the most recent Mortgage that was taken out on this home.
Original Mortgage
$237,750
Outstanding Balance
$162,217
Interest Rate
4.26%
Mortgage Type
New Conventional
Estimated Equity
$559,151
Purchase Details
Closed on
May 7, 2010
Sold by
Lovera Pamala Sue and Obrian Pamala
Bought by
Lovera Pamala Sue
Purchase Details
Closed on
Mar 23, 2009
Sold by
Bannister Gary R and Janalee Meek 2008 Trust
Bought by
Obrien Pamala
Home Financials for this Owner
Home Financials are based on the most recent Mortgage that was taken out on this home.
Original Mortgage
$200,000
Interest Rate
4.99%
Mortgage Type
Purchase Money Mortgage
Create a Home Valuation Report for This Property
The Home Valuation Report is an in-depth analysis detailing your home's value as well as a comparison with similar homes in the area
Home Values in the Area
Average Home Value in this Area
Purchase History
| Date | Buyer | Sale Price | Title Company |
|---|---|---|---|
| Lovera Pamala Sue | -- | None Available | |
| Lovera Pamala Sue | -- | Pacific Coast Title | |
| Lovera Pamala Sue | -- | None Available | |
| Obrien Pamala | $250,000 | Orange Coast Title Company |
Source: Public Records
Mortgage History
| Date | Status | Borrower | Loan Amount |
|---|---|---|---|
| Open | Lovera Pamala Sue | $237,750 | |
| Closed | Obrien Pamala | $200,000 |
Source: Public Records
Tax History Compared to Growth
Tax History
| Year | Tax Paid | Tax Assessment Tax Assessment Total Assessment is a certain percentage of the fair market value that is determined by local assessors to be the total taxable value of land and additions on the property. | Land | Improvement |
|---|---|---|---|---|
| 2025 | $4,220 | $326,853 | $234,750 | $92,103 |
| 2024 | $4,220 | $320,446 | $230,148 | $90,298 |
| 2023 | $4,033 | $314,164 | $225,636 | $88,528 |
| 2022 | $3,944 | $308,005 | $221,212 | $86,793 |
| 2021 | $3,871 | $301,967 | $216,875 | $85,092 |
| 2019 | $3,814 | $293,013 | $210,444 | $82,569 |
| 2018 | $3,697 | $287,268 | $206,318 | $80,950 |
| 2016 | $3,551 | $276,114 | $198,307 | $77,807 |
| 2015 | $3,488 | $271,968 | $195,329 | $76,639 |
| 2014 | $3,445 | $266,641 | $191,503 | $75,138 |
Source: Public Records
Map
Nearby Homes
- 6233 Haviland Ave
- 6231 Painter Ave
- 6256 Friends Ave
- 13570 Turnbull Canyon Rd
- 6226 Washington Ave
- 6544 Painter Ave
- 5827 Washington Ave
- 6217 Greenleaf Ave
- 6242 Comstock Ave
- 6723 Hillside Ln
- 13707 Philadelphia St
- 6769 Hillside Ln
- 7013 Hillside Ln
- 6251 Milton Ave
- 6333 Milton Ave
- 13867 Philadelphia St
- 6340 Newlin Ave
- 7032 Washington Ave
- 12711 Hadley St Unit 14
- 12708 Hadley St
- 6206 Haviland Ave
- 13440 Broadway
- 6212 Haviland Ave
- 6056 Haviland Ave
- 6201 Haviland Ave
- 6207 Haviland Ave
- 6211 Haviland Ave
- 13456 Broadway
- 6052 Haviland Ave
- 6057 Haviland Ave
- 6217 Haviland Ave
- 6222 Haviland Ave
- 6046 Haviland Ave
- 13453 Broadway
- 6051 Haviland Ave
- 13417 Broadway
- 13416 Broadway
- 6221 Haviland Ave
- 6219 Alta Ave
- 6226 Haviland Ave