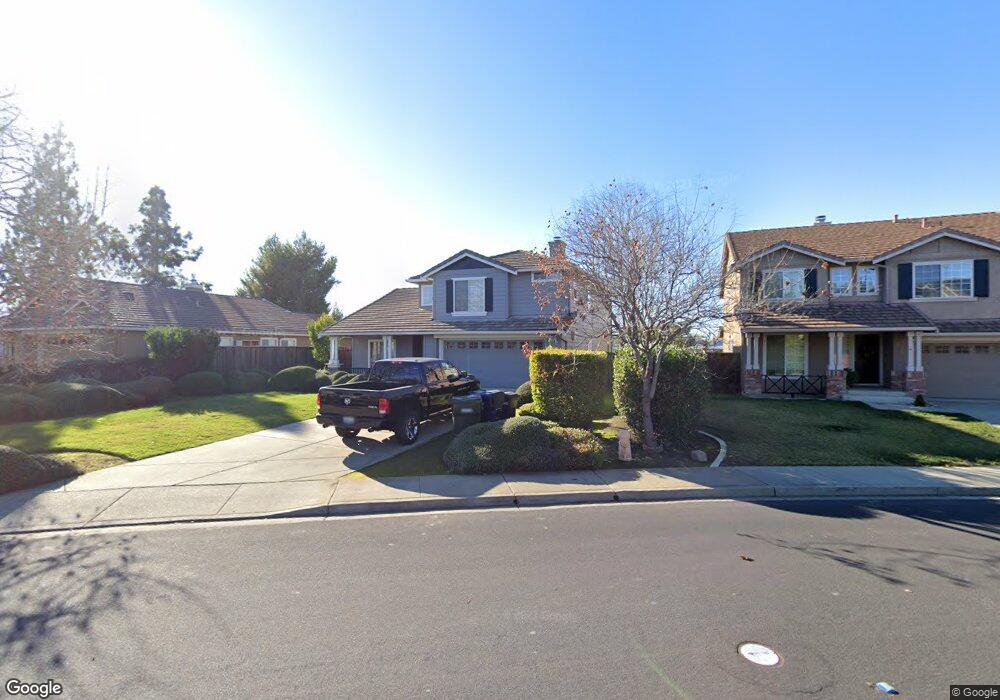
1344 Jayhawk Ln Livermore, CA 94551
Springtown NeighborhoodEstimated Value: $1,185,599 - $1,260,000
3
Beds
3
Baths
1,913
Sq Ft
$631/Sq Ft
Est. Value
About This Home
This home is located at 1344 Jayhawk Ln, Livermore, CA 94551 and is currently estimated at $1,206,900, approximately $630 per square foot. 1344 Jayhawk Ln is a home located in Alameda County with nearby schools including Altamont Creek Elementary School, Andrew N. Christensen Middle School, and Livermore High School.
Ownership History
Date
Name
Owned For
Owner Type
Purchase Details
Closed on
Jul 5, 2001
Sold by
Olsen Donald D and Olsen Kenneth F
Bought by
Olsen Donald D
Current Estimated Value
Home Financials for this Owner
Home Financials are based on the most recent Mortgage that was taken out on this home.
Original Mortgage
$255,000
Outstanding Balance
$99,127
Interest Rate
7.26%
Estimated Equity
$1,107,773
Purchase Details
Closed on
May 30, 1996
Sold by
Olsen Yvonne L
Bought by
Olsen Kenneth F
Home Financials for this Owner
Home Financials are based on the most recent Mortgage that was taken out on this home.
Original Mortgage
$202,300
Interest Rate
7.87%
Purchase Details
Closed on
Aug 8, 1995
Sold by
Ferreri John P and Blau Michael H
Bought by
Kaufman & Broad Of Northern Ca Inc
Create a Home Valuation Report for This Property
The Home Valuation Report is an in-depth analysis detailing your home's value as well as a comparison with similar homes in the area
Home Values in the Area
Average Home Value in this Area
Purchase History
| Date | Buyer | Sale Price | Title Company |
|---|---|---|---|
| Olsen Donald D | -- | Chicago Title Co | |
| Olsen Kenneth F | -- | First American Title Guarant | |
| Olsen Donald D | $253,000 | First American Title Guarant | |
| Kaufman & Broad Of Northern Ca Inc | -- | First American Title Guarant |
Source: Public Records
Mortgage History
| Date | Status | Borrower | Loan Amount |
|---|---|---|---|
| Open | Olsen Donald D | $255,000 | |
| Closed | Olsen Donald D | $202,300 |
Source: Public Records
Tax History
| Year | Tax Paid | Tax Assessment Tax Assessment Total Assessment is a certain percentage of the fair market value that is determined by local assessors to be the total taxable value of land and additions on the property. | Land | Improvement |
|---|---|---|---|---|
| 2025 | $5,822 | $420,107 | $126,082 | $294,025 |
| 2024 | $5,822 | $411,869 | $123,609 | $288,260 |
| 2023 | $5,725 | $403,794 | $121,186 | $282,608 |
| 2022 | $5,634 | $395,878 | $118,810 | $277,068 |
| 2021 | $4,770 | $388,117 | $116,481 | $271,636 |
| 2020 | $5,344 | $384,139 | $115,287 | $268,852 |
| 2019 | $5,359 | $376,608 | $113,027 | $263,581 |
| 2018 | $5,236 | $369,225 | $110,811 | $258,414 |
| 2017 | $5,096 | $361,987 | $108,639 | $253,348 |
| 2016 | $4,897 | $354,891 | $106,509 | $248,382 |
| 2015 | $4,601 | $349,562 | $104,910 | $244,652 |
| 2014 | $4,519 | $342,716 | $102,855 | $239,861 |
Source: Public Records
Map
Nearby Homes
- 1426 Jayhawk Ln
- 1433 Jayhawk Ln
- 5941 Crestmont Ave
- 5833 Singing Hills Ave
- 1174 Central Ave
- 1775 Rose Gate Common
- 5954 Running Hills Ave
- 6189 Fieldstone Dr
- 5612 Firestone Rd
- 1498 Columbine Way
- 6492 Altamar Cir
- 2060 Broadmoor St
- 1414 Columbine Way
- 6433 Aspenwood Way
- 6432 Laurel Creek Place
- 6449 Aspenwood Way
- 5981 Skylinks Way
- 6433 Owl Way
- 883 Barney Com
- 868 Berryessa Ct
- 1332 Jayhawk Ln
- 1358 Jayhawk Ln
- 1366 Jayhawk Ln
- 1353 Jayhawk Ln
- 1382 Jayhawk Ln
- 1371 Jayhawk Ln
- 1395 Jayhawk Ln
- 1404 Jayhawk Ln
- 1407 Jayhawk Ln
- 1411 Jayhawk Ln
- 1291 Central Ave
- 1296 Hyacinth Ct
- 1442 Jayhawk Ln
- 1288 Central Ave
- 1283 Central Ave
- 1284 Hyacinth Ct
- 1276 Central Ave
- 1460 Jayhawk Ln
- 1455 Jayhawk Ln
- 1265 Central Ave
Your Personal Tour Guide
Ask me questions while you tour the home.