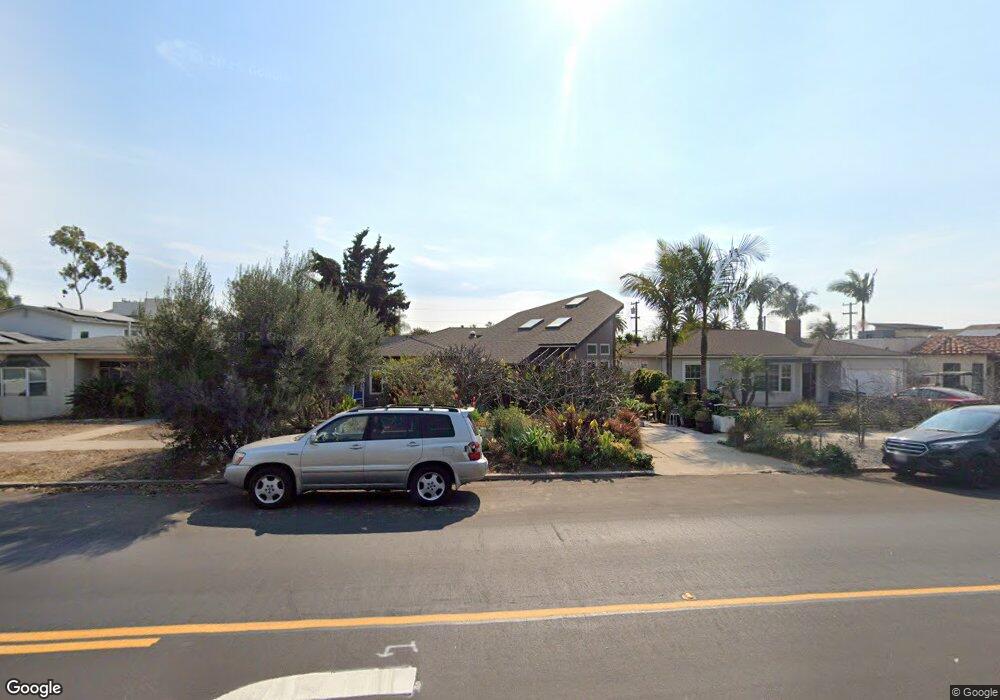
1345 Loring St San Diego, CA 92109
Pacific Beach NeighborhoodEstimated Value: $1,977,129 - $2,454,000
2
Beds
2
Baths
2,012
Sq Ft
$1,107/Sq Ft
Est. Value
About This Home
This home is located at 1345 Loring St, San Diego, CA 92109 and is currently estimated at $2,226,282, approximately $1,106 per square foot. 1345 Loring St is a home located in San Diego County with nearby schools including Pacific Beach Elementary School, Pacific Beach Middle, and Mission Bay High School.
Ownership History
Date
Name
Owned For
Owner Type
Purchase Details
Closed on
Jul 25, 2002
Sold by
Orailoglu Osia M and Strasner Roger
Bought by
Orailoglu Osia M
Current Estimated Value
Home Financials for this Owner
Home Financials are based on the most recent Mortgage that was taken out on this home.
Original Mortgage
$150,496
Interest Rate
6.05%
Purchase Details
Closed on
Sep 18, 1995
Sold by
Barfield Billie C and Barfield Janna
Bought by
Orailoglu Osia M
Home Financials for this Owner
Home Financials are based on the most recent Mortgage that was taken out on this home.
Original Mortgage
$160,800
Interest Rate
7.67%
Purchase Details
Closed on
Feb 23, 1994
Sold by
Coe Donald J
Bought by
Donald J Coe Revocable Inter Vivos Trust
Create a Home Valuation Report for This Property
The Home Valuation Report is an in-depth analysis detailing your home's value as well as a comparison with similar homes in the area
Home Values in the Area
Average Home Value in this Area
Purchase History
| Date | Buyer | Sale Price | Title Company |
|---|---|---|---|
| Orailoglu Osia M | -- | South Coast Title Company | |
| Orailoglu Osia M | $201,000 | First American Title Co | |
| Donald J Coe Revocable Inter Vivos Trust | -- | -- |
Source: Public Records
Mortgage History
| Date | Status | Borrower | Loan Amount |
|---|---|---|---|
| Closed | Orailoglu Osia M | $150,496 | |
| Closed | Orailoglu Osia M | $160,800 |
Source: Public Records
Tax History Compared to Growth
Tax History
| Year | Tax Paid | Tax Assessment Tax Assessment Total Assessment is a certain percentage of the fair market value that is determined by local assessors to be the total taxable value of land and additions on the property. | Land | Improvement |
|---|---|---|---|---|
| 2025 | $6,907 | $575,681 | $265,787 | $309,894 |
| 2024 | $6,907 | $564,394 | $260,576 | $303,818 |
| 2023 | $6,750 | $553,328 | $255,467 | $297,861 |
| 2022 | $6,570 | $542,479 | $250,458 | $292,021 |
| 2021 | $6,522 | $531,844 | $245,548 | $286,296 |
| 2020 | $6,442 | $526,392 | $243,031 | $283,361 |
| 2019 | $6,326 | $516,071 | $238,266 | $277,805 |
| 2018 | $5,914 | $505,953 | $233,595 | $272,358 |
| 2017 | $5,772 | $496,033 | $229,015 | $267,018 |
| 2016 | $5,678 | $486,308 | $224,525 | $261,783 |
| 2015 | $4,922 | $421,875 | $221,153 | $200,722 |
| 2014 | $4,843 | $413,612 | $216,821 | $196,791 |
Source: Public Records
Map
Nearby Homes
- 1505 Loring St
- 5209 Foothill Blvd
- 1154 Sapphire St
- 1025 Wilbur Ave
- 1148 Turquoise St
- 1712 Beryl St
- 4944 Cass St Unit 604
- 4944 Cass St Unit 407
- 1270 Emerald St
- 4733 Ingraham St
- 1220 Emerald St
- 1059 Agate St Unit A
- 1737 Beryl St
- 938 Opal St
- 972 Sapphire St Unit LA1
- 974 Sapphire St Unit LA2
- 4964 Kendall St
- 976 Sapphire St Unit LA3
- 1645 Los Altos Rd
- 5108 Gordon Ln
- 1335 Loring St
- 1351 Loring St
- 1359 Loring St
- 1344 Wilbur Ave
- 1367 Loring St
- 1319 Loring St
- 1352 Wilbur Ave
- 1338 Wilbur Ave
- 1360 Wilbur Ave
- 1330 Wilbur Ave
- 1375 Loring St
- 1311 Loring St
- 1370 Wilbur Ave
- 1320 Wilbur Ave
- 1376 Wilbur Ave
- 1332 Loring St
- 1312 Wilbur Ave
- 1350 Loring St
- 4995 Fanuel St
- 1326 Loring St