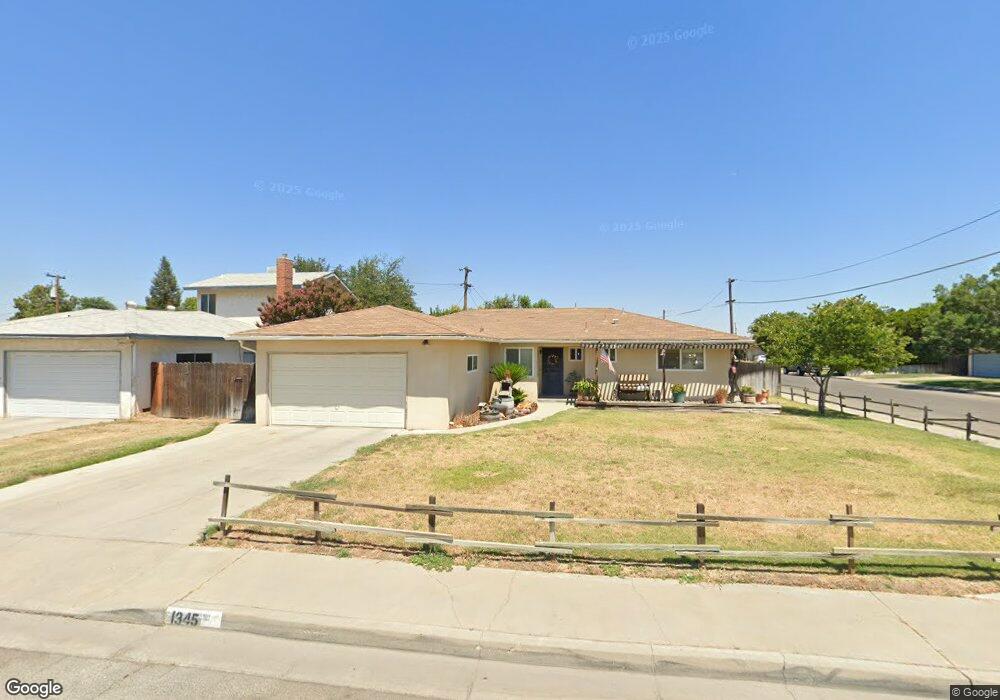
1345 Terry Ave Clovis, CA 93612
Estimated Value: $358,000 - $360,241
3
Beds
2
Baths
1,370
Sq Ft
$262/Sq Ft
Est. Value
About This Home
This home is located at 1345 Terry Ave, Clovis, CA 93612 and is currently estimated at $359,414, approximately $262 per square foot. 1345 Terry Ave is a home located in Fresno County with nearby schools including Sierra Vista Elementary School, Clark Intermediate School, and Clovis High School.
Ownership History
Date
Name
Owned For
Owner Type
Purchase Details
Closed on
Sep 6, 2011
Sold by
Pierce Lloyd Henry and Pierce Aliceann
Bought by
Pierce Aliceann
Current Estimated Value
Purchase Details
Closed on
Dec 18, 2003
Sold by
Pratt Vickie L and Pratt Duane C
Bought by
Pierce Lloyd H and Pierce Alice Ann
Purchase Details
Closed on
Sep 17, 2003
Sold by
Satterfield Jim R and Satterfield Saundra L
Bought by
Satterfield Jim R and Satterfield Saundra L
Home Financials for this Owner
Home Financials are based on the most recent Mortgage that was taken out on this home.
Original Mortgage
$46,891
Interest Rate
6.17%
Mortgage Type
Purchase Money Mortgage
Purchase Details
Closed on
Jan 1, 1996
Sold by
Satterfield Jim R and Satterfield Saundra L
Bought by
Satterfield Jim R and Satterfield Saundra L
Create a Home Valuation Report for This Property
The Home Valuation Report is an in-depth analysis detailing your home's value as well as a comparison with similar homes in the area
Home Values in the Area
Average Home Value in this Area
Purchase History
| Date | Buyer | Sale Price | Title Company |
|---|---|---|---|
| Pierce Aliceann | -- | None Available | |
| Pierce Lloyd H | $147,000 | First American Title Ins Co | |
| Pratt Vickie L | -- | First American Title Ins Co | |
| Satterfield Jim R | -- | Chicago Title Company | |
| Satterfield Jim R | -- | Chicago Title Company | |
| Satterfield Jim R | -- | Landmark Title Company |
Source: Public Records
Mortgage History
| Date | Status | Borrower | Loan Amount |
|---|---|---|---|
| Previous Owner | Satterfield Jim R | $46,891 |
Source: Public Records
Tax History
| Year | Tax Paid | Tax Assessment Tax Assessment Total Assessment is a certain percentage of the fair market value that is determined by local assessors to be the total taxable value of land and additions on the property. | Land | Improvement |
|---|---|---|---|---|
| 2025 | $2,105 | $176,711 | $44,307 | $132,404 |
| 2023 | $2,026 | $169,851 | $42,588 | $127,263 |
| 2022 | $1,999 | $166,521 | $41,753 | $124,768 |
| 2021 | $1,944 | $163,257 | $40,935 | $122,322 |
| 2020 | $1,936 | $161,584 | $40,516 | $121,068 |
| 2019 | $1,899 | $158,417 | $39,722 | $118,695 |
| 2018 | $1,858 | $155,312 | $38,944 | $116,368 |
| 2017 | $1,827 | $152,268 | $38,181 | $114,087 |
| 2016 | $1,765 | $149,283 | $37,433 | $111,850 |
| 2015 | $1,739 | $147,041 | $36,871 | $110,170 |
| 2014 | $1,707 | $126,500 | $44,000 | $82,500 |
Source: Public Records
Map
Nearby Homes
- 1314 Terry Ave
- 1335 Cindy Ave
- 487 W San Jose Ave
- 1500 Villa Ave Unit 107
- 1500 Villa Ave Unit 170
- 1500 Villa Ave Unit 27
- 1500 Villa Ave Unit spc 7
- 1272 Villa Ave Unit 69
- 1272 Villa Ave Unit 76
- 1272 Villa Ave Unit SPC92
- 647 W Dennis Dr
- 1650 Villa Ave Unit 48
- 3600 W Shaw Ave
- 1468 Plymouth Rock Way
- 1416 Plymouth Rock Way
- 1448 Plymouth Rock Way
- 1629 Willow Ave
- 1001 Sylmar Ave Unit 3
- 1001 Sylmar Ave Unit 131
- 1001 Sylmar Ave Unit 99
- 1335 Terry Ave
- 1344 Karen Ave
- 1325 Terry Ave
- 498 W Mitchell Ave
- 1324 Karen Ave
- 508 W Mitchell Ave
- 1344 Terry Ave
- 488 W Mitchell Ave
- 1334 Terry Ave
- 1315 Terry Ave
- 518 W Mitchell Ave
- 478 W Mitchell Ave
- 1324 Terry Ave
- 1314 Karen Ave
- 528 W Mitchell Ave
- 468 W Mitchell Ave
- 1305 Terry Ave
- 497 W Dennis Dr
- 1304 Karen Ave
- 507 W Dennis Dr
Your Personal Tour Guide
Ask me questions while you tour the home.