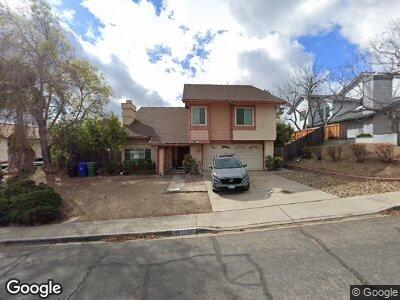
13450 Black Hills Rd San Diego, CA 92129
Rancho Peñasquitos NeighborhoodEstimated Value: $1,524,000 - $1,576,000
4
Beds
3
Baths
2,676
Sq Ft
$577/Sq Ft
Est. Value
About This Home
This home is located at 13450 Black Hills Rd, San Diego, CA 92129 and is currently estimated at $1,544,916, approximately $577 per square foot. 13450 Black Hills Rd is a home located in San Diego County with nearby schools including Sunset Hills Elementary School, Black Mountain Middle School, and Mt. Carmel High School.
Ownership History
Date
Name
Owned For
Owner Type
Purchase Details
Closed on
Mar 25, 2015
Sold by
Felton Osceola D and Felton Jacqueline S
Bought by
Felton Osceola D and Felton Jacqueline S
Current Estimated Value
Home Financials for this Owner
Home Financials are based on the most recent Mortgage that was taken out on this home.
Original Mortgage
$345,000
Interest Rate
3.71%
Mortgage Type
New Conventional
Purchase Details
Closed on
Aug 6, 2010
Sold by
Felton Osceola D and Felton Jacqueline S
Bought by
Felton Osceola D and Felton Jacqueline S
Purchase Details
Closed on
May 21, 1986
Bought by
Felton Osceola D Jacqueline S
Create a Home Valuation Report for This Property
The Home Valuation Report is an in-depth analysis detailing your home's value as well as a comparison with similar homes in the area
Home Values in the Area
Average Home Value in this Area
Purchase History
| Date | Buyer | Sale Price | Title Company |
|---|---|---|---|
| Felton Osceola D | -- | Pacific Coast Title | |
| Felton Osceola D | -- | Pacific Coast Title | |
| Felton Osceola D | -- | None Available | |
| Felton Osceola D | -- | None Available | |
| Felton Osceola D Jacqueline S | $168,000 | -- |
Source: Public Records
Mortgage History
| Date | Status | Borrower | Loan Amount |
|---|---|---|---|
| Open | Felton Jacqueline S | $527,500 | |
| Closed | Felton Osceola D | $449,414 | |
| Closed | Felton Osceola D | $454,481 | |
| Closed | Felton Osceola D | $459,685 | |
| Closed | Felton Osceola D | $414,233 | |
| Closed | Felton Osceola D | $345,000 | |
| Closed | Felton Osceola D | $310,000 | |
| Closed | Felton Osceola D | $50,000 | |
| Closed | Felton Osceola D | $275,000 | |
| Closed | Felton Jacqueline S | $250,000 | |
| Closed | Felton Osceola D | $210,201 |
Source: Public Records
Tax History Compared to Growth
Tax History
| Year | Tax Paid | Tax Assessment Tax Assessment Total Assessment is a certain percentage of the fair market value that is determined by local assessors to be the total taxable value of land and additions on the property. | Land | Improvement |
|---|---|---|---|---|
| 2024 | $3,673 | $327,965 | $105,785 | $222,180 |
| 2023 | $3,592 | $321,535 | $103,711 | $217,824 |
| 2022 | $3,529 | $315,231 | $101,678 | $213,553 |
| 2021 | $3,481 | $309,051 | $99,685 | $209,366 |
| 2020 | $3,433 | $305,883 | $98,663 | $207,220 |
| 2019 | $3,343 | $299,886 | $96,729 | $203,157 |
| 2018 | $3,248 | $294,007 | $94,833 | $199,174 |
| 2017 | $3,159 | $288,243 | $92,974 | $195,269 |
| 2016 | $3,092 | $282,592 | $91,151 | $191,441 |
| 2015 | $3,045 | $278,348 | $89,782 | $188,566 |
| 2014 | $2,973 | $272,897 | $88,024 | $184,873 |
Source: Public Records
Map
Nearby Homes
- 9409 Aldabra Ct
- 13519 Hike Ln Unit 2
- 9845 Paseo Montalban
- 9501 High Park Ln
- 9757 Caminito Cuadro
- 9525 High Park Ln
- 9832 Caminito Cuadro
- 9858 Via Caceres
- 9142 Ellingham St
- 13837 Paseo Cardiel
- 9665 Palm Beach Ln
- 13134 Cayote Ave
- 9959 Riverhead Dr
- 13584 Freeport Rd
- 9521 Oviedo St
- 9010 Oviedo St
- 10118 Freeport Ct
- 8985 Talca Ct
- 13146 Thunderhead St
- 13130 Via Del Valedor
- 13450 Black Hills Rd
- 13446 Black Hills Rd
- 13454 Black Hills Rd
- 13455 Salmon River Rd
- 13447 Salmon River Rd
- 13442 Black Hills Rd
- 13458 Black Hills Rd
- 13439 Salmon River Rd
- 13462 Black Hills Rd
- 13438 Black Hills Rd
- 13447 Black Hills Rd
- 13451 Black Hills Rd
- 13443 Black Hills Rd
- 13435 Salmon River Rd
- 13455 Black Hills Rd
- 13439 Black Hills Rd
- 13466 Black Hills Rd
- 13452 Salmon River Rd
- 13434 Black Hills Rd
- 13456 Salmon River Rd