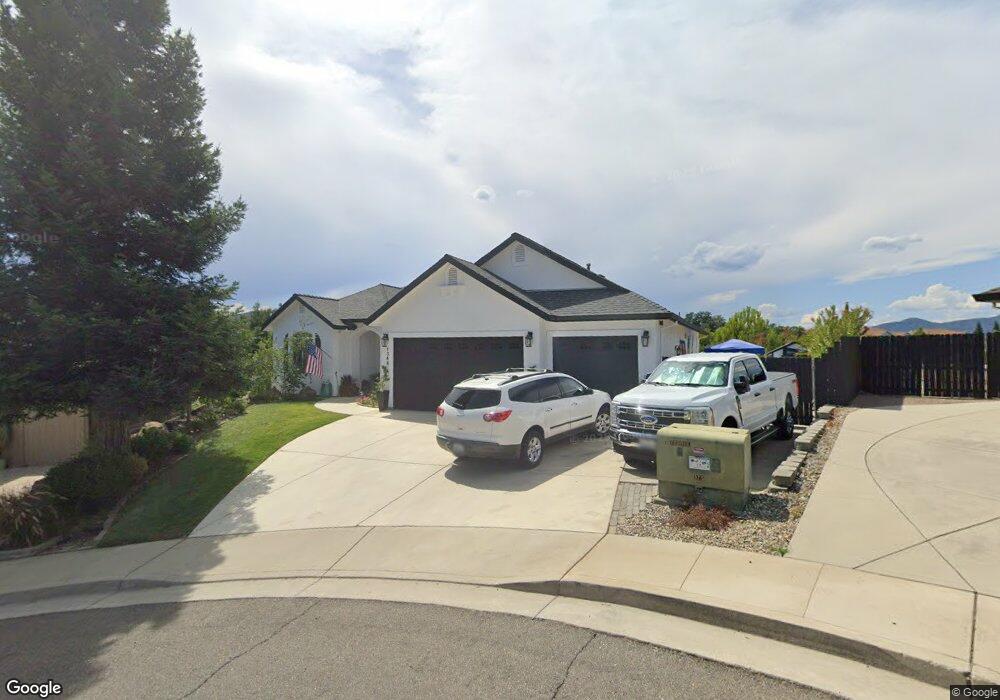
1346 Jen Ct Unit Lot 19 Redding, CA 96001
Manzanita NeighborhoodEstimated Value: $471,690 - $620,000
3
Beds
2
Baths
1,858
Sq Ft
$280/Sq Ft
Est. Value
About This Home
This home is located at 1346 Jen Ct Unit Lot 19, Redding, CA 96001 and is currently estimated at $519,673, approximately $279 per square foot. 1346 Jen Ct Unit Lot 19 is a home located in Shasta County with nearby schools including Manzanita Elementary School, Sequoia Middle School, and Shasta High School.
Ownership History
Date
Name
Owned For
Owner Type
Purchase Details
Closed on
Jan 6, 2021
Sold by
West Kenneth D
Bought by
West Kenneth D and Kenneth D West 2020 Trust
Current Estimated Value
Home Financials for this Owner
Home Financials are based on the most recent Mortgage that was taken out on this home.
Original Mortgage
$261,000
Outstanding Balance
$232,491
Interest Rate
2.6%
Mortgage Type
New Conventional
Estimated Equity
$287,182
Purchase Details
Closed on
Mar 17, 2020
Sold by
West Kenneth D
Bought by
West Kenneth D and Kenneth D West 2020 Trust
Purchase Details
Closed on
Oct 12, 2015
Sold by
Workman Paul E and Workman Chang N
Bought by
West Kenneth D and Mary E West Revocable F
Home Financials for this Owner
Home Financials are based on the most recent Mortgage that was taken out on this home.
Original Mortgage
$220,000
Interest Rate
3.86%
Mortgage Type
New Conventional
Purchase Details
Closed on
Jan 25, 2008
Sold by
Premier Homes Properties Inc
Bought by
Workman Paul E and Workman Chang N
Create a Home Valuation Report for This Property
The Home Valuation Report is an in-depth analysis detailing your home's value as well as a comparison with similar homes in the area
Home Values in the Area
Average Home Value in this Area
Purchase History
We collect this data history from publicly available records. To have your information removed, we recommend requesting removal directly through your county’s website.
| Date | Buyer | Sale Price | Title Company |
|---|---|---|---|
| West Kenneth D | -- | Placer Title Company | |
| West Kenneth D | -- | Placer Title Company | |
| West Kenneth D | -- | None Available | |
| West Kenneth D | -- | None Available | |
| West Kenneth D | $310,000 | Fidelity Natl Title Co Of Ca | |
| Workman Paul E | $325,000 | Placer Title Company |
Source: Public Records
Mortgage History
We collect this data history from publicly available records. To have your information removed, we recommend requesting removal directly through your county’s website.
| Date | Status | Borrower | Loan Amount |
|---|---|---|---|
| Open | West Kenneth D | $261,000 | |
| Closed | West Kenneth D | $220,000 |
Source: Public Records
Tax History
| Year | Tax Paid | Tax Assessment Tax Assessment Total Assessment is a certain percentage of the fair market value that is determined by local assessors to be the total taxable value of land and additions on the property. | Land | Improvement |
|---|---|---|---|---|
| 2025 | $4,192 | $377,182 | $82,861 | $294,321 |
| 2024 | $4,116 | $369,787 | $81,237 | $288,550 |
| 2023 | $4,116 | $362,538 | $79,645 | $282,893 |
| 2022 | $4,040 | $355,431 | $78,084 | $277,347 |
| 2021 | $4,012 | $348,462 | $76,553 | $271,909 |
| 2020 | $4,039 | $344,890 | $75,769 | $269,121 |
| 2019 | $3,833 | $338,129 | $74,284 | $263,845 |
| 2018 | $3,865 | $331,500 | $72,828 | $258,672 |
| 2017 | $3,554 | $316,200 | $71,400 | $244,800 |
| 2016 | $3,614 | $310,000 | $70,000 | $240,000 |
| 2015 | $3,363 | $298,000 | $70,000 | $228,000 |
| 2014 | $3,337 | $281,000 | $65,000 | $216,000 |
Source: Public Records
Map
Nearby Homes
- 3856 Westgate Ave
- 1430 Ridge Dr
- 4178 Sunflower Dr
- 1433 Lakeside Dr
- 3701 Cal Ore Dr
- 938 Leisha Ln
- 1688 El Capitan Dr
- 3658 Rosita Dr
- 3345 Oakwood Place
- 1355 Bambury Ct
- 3197 Pinot Path
- 3330 Scenic Dr
- 920 Hallmark Dr
- 3126 Riesling Path
- 1692 Kildare Dr
- 3380 Placer St
- 4160 Travona Ct
- 3882 Fujiyama Way
- 3410 Scenic Dr
- 1525 Oak St
- 1346 Jen Ct
- 1396 Jen Ct
- 1300 Jen Ct Unit 20
- 1300 Jen Ct
- 1395 Jen Ct
- 2090 Buenaventura Blvd
- Lot 6 Buenaventura Blvd
- 0 Buenaventura Blvd
- 1355 Jen Ct Unit Lot 21
- 1355 Jen Ct
- 1406 Jen Way Unit 17
- 1406 Jen Way
- 1407 Jen Way Unit Lot 35
- 1407 Jen Way
- 1418 Jen Way Unit Lot 16
- 1418 Jen Way
- 1174 Lakeside Dr
- 1427 Jen Way Unit Lot 34
- 1427 Jen Way
- 1156 Lakeside Dr Unit Lot 24
Your Personal Tour Guide
Ask me questions while you tour the home.