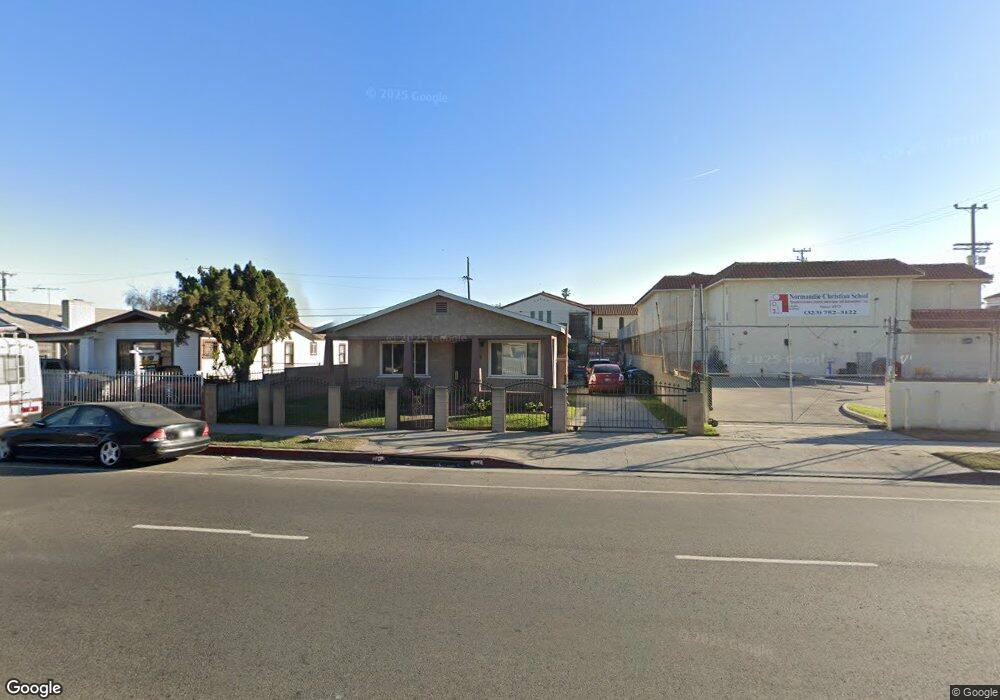
1346 W Gage Ave Los Angeles, CA 90044
Vermont-Slauson NeighborhoodEstimated Value: $632,000 - $784,067
3
Beds
1
Bath
1,468
Sq Ft
$483/Sq Ft
Est. Value
About This Home
This home is located at 1346 W Gage Ave, Los Angeles, CA 90044 and is currently estimated at $708,767, approximately $482 per square foot. 1346 W Gage Ave is a home located in Los Angeles County with nearby schools including John Muir Middle School, Augustus F. Hawkins High A Critical Design And Gaming, and George Washington Preparatory High School.
Ownership History
Date
Name
Owned For
Owner Type
Purchase Details
Closed on
Sep 9, 2009
Sold by
Propert Gordon La Donna Renee and Propert Mary L Hooker Separate
Bought by
Gordon La Donna Renee
Current Estimated Value
Purchase Details
Closed on
Mar 12, 2009
Sold by
Hooker Mary L
Bought by
Propert Hooker Mary L and Propert Mary L Hooker Separate
Purchase Details
Closed on
Jun 24, 2005
Sold by
Hooker Mary L and Gordon La Donna R
Bought by
Gordon Ladonna R and Hooker Mary L
Home Financials for this Owner
Home Financials are based on the most recent Mortgage that was taken out on this home.
Original Mortgage
$85,000
Interest Rate
5.58%
Mortgage Type
New Conventional
Purchase Details
Closed on
May 4, 2000
Sold by
Hooker Mary L
Bought by
Hooker Mary L and Gordon Ladonna R
Home Financials for this Owner
Home Financials are based on the most recent Mortgage that was taken out on this home.
Original Mortgage
$60,400
Interest Rate
8.22%
Create a Home Valuation Report for This Property
The Home Valuation Report is an in-depth analysis detailing your home's value as well as a comparison with similar homes in the area
Home Values in the Area
Average Home Value in this Area
Purchase History
| Date | Buyer | Sale Price | Title Company |
|---|---|---|---|
| Gordon La Donna Renee | -- | None Available | |
| Propert Hooker Mary L | -- | None Available | |
| Gordon Ladonna R | -- | Alliance Title Company | |
| Hooker Mary L | -- | Fidelity National Title | |
| Gordan Ladonna R | -- | Fidelity National Title |
Source: Public Records
Mortgage History
| Date | Status | Borrower | Loan Amount |
|---|---|---|---|
| Previous Owner | Gordon Ladonna R | $85,000 | |
| Previous Owner | Hooker Mary L | $60,400 |
Source: Public Records
Tax History Compared to Growth
Tax History
| Year | Tax Paid | Tax Assessment Tax Assessment Total Assessment is a certain percentage of the fair market value that is determined by local assessors to be the total taxable value of land and additions on the property. | Land | Improvement |
|---|---|---|---|---|
| 2025 | $3,840 | $38,412 | $27,173 | $11,239 |
| 2024 | $3,840 | $37,660 | $26,641 | $11,019 |
| 2023 | $3,834 | $36,922 | $26,119 | $10,803 |
| 2022 | $3,812 | $36,199 | $25,607 | $10,592 |
| 2021 | $3,794 | $35,490 | $25,105 | $10,385 |
| 2020 | $3,796 | $35,127 | $24,848 | $10,279 |
| 2019 | $3,779 | $34,439 | $24,361 | $10,078 |
| 2018 | $3,687 | $33,765 | $23,884 | $9,881 |
| 2016 | $597 | $32,456 | $22,957 | $9,499 |
| 2015 | $591 | $31,970 | $22,613 | $9,357 |
| 2014 | $610 | $31,345 | $22,171 | $9,174 |
Source: Public Records
Map
Nearby Homes
- 1337 W Gage Ave
- 1417 W Gage Ave
- 1253 W 65th St
- 1257 W 60th Place
- 1346 W 59th Place
- 1512 W 60th St
- 1143 W 66th St
- 1619 W Gage Ave
- 1513 W 60th St
- 1103 W 64th St
- 1500 W 59th Place
- 1053 W Gage Ave
- 1601 W 67th St
- 1438 W 69th St
- 1626 W 60th Place
- 1407 W 59th Place
- 1548 W 59th Place
- 1049 W 61st St
- 1259 W 59th St
- 1555 W 59th Place
- 1342 W Gage Ave
- 1336 W Gage Ave
- 1332 W Gage Ave
- 1347 W Gage Ave
- 1353 W Gage Ave
- 1343 W Gage Ave
- 1327 W 64th St
- 1326 W Gage Ave Unit 2
- 1326 W Gage Ave
- 1322 W Gage Ave
- 1357 W Gage Ave
- 1333 W Gage Ave
- 1323 W 64th St
- 1327 W Gage Ave
- 1316 W Gage Ave
- 6223 S Normandie Ave
- 1344 W 64th St
- 1348 W 64th St
- 1323 W Gage Ave
- 1340 W 64th St