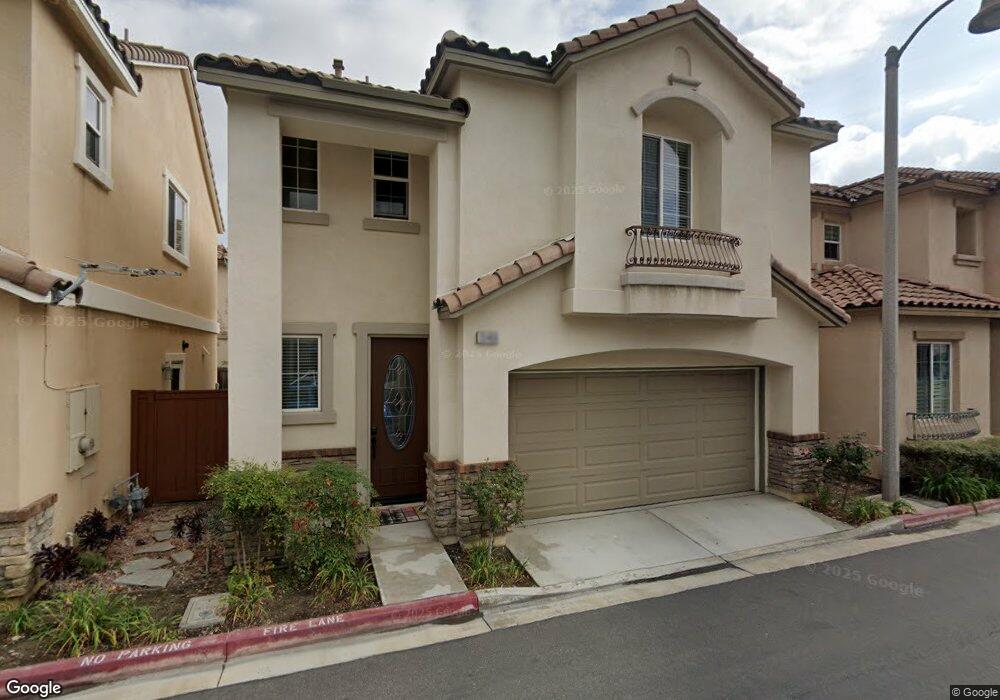
13466 Freedom Way Westminster, CA 92683
Estimated Value: $887,995 - $995,000
3
Beds
3
Baths
1,461
Sq Ft
$648/Sq Ft
Est. Value
About This Home
This home is located at 13466 Freedom Way, Westminster, CA 92683 and is currently estimated at $946,249, approximately $647 per square foot. 13466 Freedom Way is a home located in Orange County with nearby schools including Schmitt Elementary, Johnson Middle, and Westminster High School.
Ownership History
Date
Name
Owned For
Owner Type
Purchase Details
Closed on
Aug 5, 2021
Sold by
Moieny Yashar
Bought by
Moieny Yashar and The Yashar Moieny Trust
Current Estimated Value
Purchase Details
Closed on
Mar 13, 2021
Sold by
Moieny Yashar
Bought by
Moieny Yashar and Ly Tiffany T
Home Financials for this Owner
Home Financials are based on the most recent Mortgage that was taken out on this home.
Original Mortgage
$525,000
Outstanding Balance
$472,983
Interest Rate
3%
Mortgage Type
New Conventional
Estimated Equity
$473,266
Purchase Details
Closed on
Nov 3, 2009
Sold by
Westminster Housing Group Llc
Bought by
Moieny Yashar
Home Financials for this Owner
Home Financials are based on the most recent Mortgage that was taken out on this home.
Original Mortgage
$476,205
Interest Rate
4.92%
Mortgage Type
FHA
Create a Home Valuation Report for This Property
The Home Valuation Report is an in-depth analysis detailing your home's value as well as a comparison with similar homes in the area
Home Values in the Area
Average Home Value in this Area
Purchase History
| Date | Buyer | Sale Price | Title Company |
|---|---|---|---|
| Moieny Yashar | -- | None Available | |
| Moieny Yashar | -- | Stewart Title Guaranty Co | |
| Moieny Yashar | $485,000 | Orange Coast Title Company |
Source: Public Records
Mortgage History
| Date | Status | Borrower | Loan Amount |
|---|---|---|---|
| Open | Moieny Yashar | $525,000 | |
| Closed | Moieny Yashar | $476,205 |
Source: Public Records
Tax History
| Year | Tax Paid | Tax Assessment Tax Assessment Total Assessment is a certain percentage of the fair market value that is determined by local assessors to be the total taxable value of land and additions on the property. | Land | Improvement |
|---|---|---|---|---|
| 2025 | $8,172 | $686,008 | $422,643 | $263,365 |
| 2024 | $8,172 | $672,557 | $414,356 | $258,201 |
| 2023 | $7,896 | $659,370 | $406,231 | $253,139 |
| 2022 | $7,777 | $646,442 | $398,266 | $248,176 |
| 2021 | $6,982 | $578,356 | $332,458 | $245,898 |
| 2020 | $6,901 | $572,426 | $329,049 | $243,377 |
| 2019 | $6,824 | $561,202 | $322,597 | $238,605 |
| 2018 | $6,825 | $550,199 | $316,272 | $233,927 |
| 2017 | $6,568 | $539,411 | $310,070 | $229,341 |
| 2016 | $6,362 | $528,835 | $303,990 | $224,845 |
| 2015 | $6,255 | $520,892 | $299,424 | $221,468 |
| 2014 | $6,116 | $510,689 | $293,559 | $217,130 |
Source: Public Records
Map
Nearby Homes
- 13622 Illinois St
- 6751 Klondike Ave
- 13822 Olive St
- 7603 23rd St
- 13161 Summit Cir
- 13523 Cobblestone Ln
- 13942 Locust St
- 13202 Hoover St Unit 42
- 7106 Brentwood Ln
- 14116 Rondeau St
- 14101 Rondeau St
- 7161 Main St
- 7700 Lampson Ave Unit 117
- 7700 Lampson Ave Unit 52
- 7700 Lampson Ave Unit 94
- 7700 Lampson Ave Unit 62
- 7700 Lampson Ave Unit 15
- 7700 Lampson Ave Unit 100
- 7700 Lampson Ave Unit 138
- 6282 Cheyenne Dr
- 13464 Freedom Way
- 13468 Freedom Way
- 13465 Liberty Way
- 13463 Liberty Way
- 13467 Liberty Way
- 13460 Freedom Way
- 13465 Freedom Way
- 13463 Freedom Way Unit 1
- 13463 Freedom Way
- 13461 Liberty Way
- 13467 Freedom Way
- 13469 Liberty Way
- 13461 Freedom Way
- 13458 Freedom Way
- 13472 Freedom Way
- 13466 Liberty Way
- 13459 Liberty Way
- 13471 Liberty Way
- 13469 Freedom Way
- 13464 Liberty Way
Your Personal Tour Guide
Ask me questions while you tour the home.