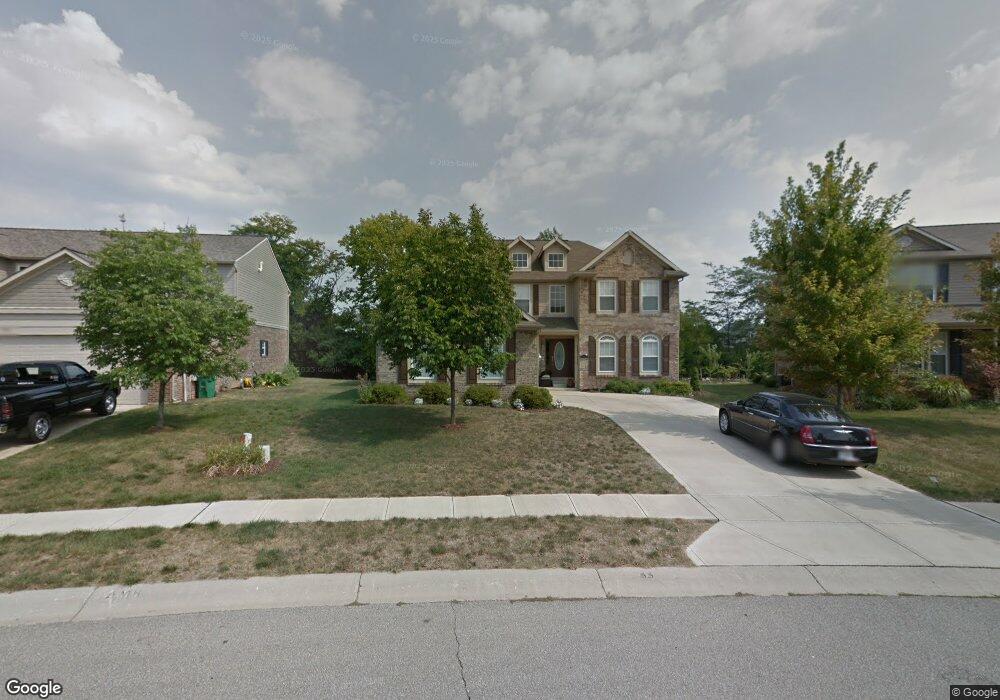
13467 Guy St Fishers, IN 46038
Estimated Value: $461,000
4
Beds
3
Baths
4,085
Sq Ft
$113/Sq Ft
Est. Value
About This Home
This home is located at 13467 Guy St, Fishers, IN 46038 and is currently priced at $461,000, approximately $112 per square foot. 13467 Guy St is a home located in Hamilton County with nearby schools including Sand Creek Elementary School, Sand Creek Intermediate School, and Fishers Junior High School.
Ownership History
Date
Name
Owned For
Owner Type
Purchase Details
Closed on
Oct 14, 2011
Sold by
D & R Real Estate Llc
Bought by
Leitze Jason and Leitze Amy
Current Estimated Value
Home Financials for this Owner
Home Financials are based on the most recent Mortgage that was taken out on this home.
Original Mortgage
$224,071
Outstanding Balance
$151,120
Interest Rate
3.87%
Mortgage Type
FHA
Purchase Details
Closed on
Oct 27, 2009
Sold by
Household Finance Corporation Iii
Bought by
D & R Real Estate Llc
Purchase Details
Closed on
Sep 17, 2009
Sold by
Jemerson Marlon
Bought by
Household Finance Corporation Iii
Purchase Details
Closed on
Mar 31, 2006
Sold by
Dura Builders Inc
Bought by
Jemerson Marlon
Home Financials for this Owner
Home Financials are based on the most recent Mortgage that was taken out on this home.
Original Mortgage
$203,162
Interest Rate
6.42%
Mortgage Type
FHA
Create a Home Valuation Report for This Property
The Home Valuation Report is an in-depth analysis detailing your home's value as well as a comparison with similar homes in the area
Home Values in the Area
Average Home Value in this Area
Purchase History
| Date | Buyer | Sale Price | Title Company |
|---|---|---|---|
| Leitze Jason | -- | Chicago Title | |
| D & R Real Estate Llc | -- | None Available | |
| Household Finance Corporation Iii | $173,867 | None Available | |
| Jemerson Marlon | -- | Stewart Title Svcs In Inc |
Source: Public Records
Mortgage History
| Date | Status | Borrower | Loan Amount |
|---|---|---|---|
| Open | Leitze Jason | $224,071 | |
| Previous Owner | Jemerson Marlon | $203,162 |
Source: Public Records
Tax History Compared to Growth
Tax History
| Year | Tax Paid | Tax Assessment Tax Assessment Total Assessment is a certain percentage of the fair market value that is determined by local assessors to be the total taxable value of land and additions on the property. | Land | Improvement |
|---|---|---|---|---|
| 2023 | $4,369 | $417,200 | $57,000 | $360,200 |
| 2022 | $4,369 | $363,900 | $57,000 | $306,900 |
| 2021 | $3,471 | $305,700 | $57,000 | $248,700 |
| 2020 | -- | $287,500 | $57,000 | $230,500 |
| 2019 | -- | $263,500 | $40,000 | $223,500 |
| 2018 | -- | $244,400 | $40,000 | $204,400 |
| 2017 | -- | $228,800 | $40,000 | $188,800 |
| 2016 | -- | $233,100 | $40,000 | $193,100 |
| 2014 | -- | $215,000 | $40,000 | $175,000 |
| 2013 | -- | $228,200 | $40,000 | $188,200 |
Source: Public Records
Map
Nearby Homes
- 13703 Van Buren Place
- 11581 Beardsley Way
- 11069 Chandler Way
- 13855 Boulder Canyon Dr
- 11090 Sanders Dr
- 13410 White Granite Dr Unit 1100
- 13281 Middlewood Ln
- 13415 White Granite Dr Unit 600
- 12075 Scoria Dr Unit 500
- 10713 Summerwood Ln
- 10873 Glazer Way
- 12622 Whisper Way
- 14279 Hidden Lakes Dr
- 14231 Coyote Ridge Dr
- 12236 Quarterback Ln
- The Pendula Plan at Marilyn Woods - The Signature Collection
- The Holbrook Plan at Marilyn Woods - The Courtyard Collection
- The Landram Plan at Marilyn Woods - The Classic Collection
- The Hoosier Plan at Marilyn Woods - The Signature Collection
- The Ditney Plan at Marilyn Woods - The Classic Collection