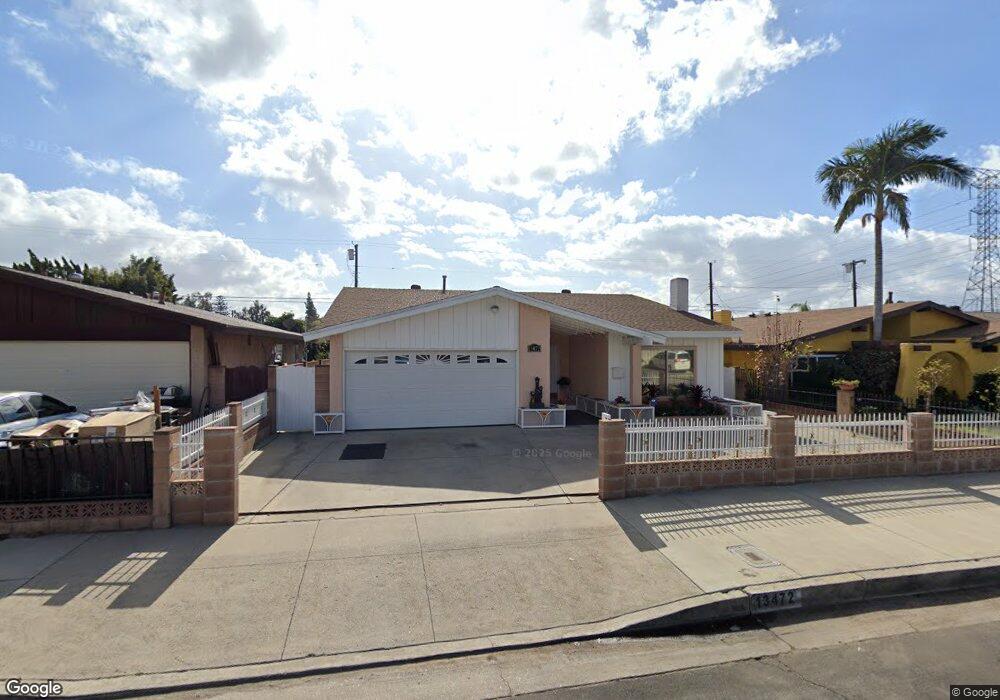
13472 Chase St Arleta, CA 91331
Estimated Value: $768,000 - $898,704
3
Beds
2
Baths
2,069
Sq Ft
$408/Sq Ft
Est. Value
About This Home
This home is located at 13472 Chase St, Arleta, CA 91331 and is currently estimated at $843,926, approximately $407 per square foot. 13472 Chase St is a home located in Los Angeles County with nearby schools including Canterbury Avenue Elementary School, Richard E. Byrd Middle School, and Arleta High.
Ownership History
Date
Name
Owned For
Owner Type
Purchase Details
Closed on
Aug 25, 2022
Sold by
Sidhu Charanjiv K
Bought by
Jcm Trust and Sidhu
Current Estimated Value
Purchase Details
Closed on
Jul 21, 2004
Sold by
Sidhu Joginder Singh and Sidhu Charanjiv K
Bought by
Sidhu Charanjiv K
Home Financials for this Owner
Home Financials are based on the most recent Mortgage that was taken out on this home.
Original Mortgage
$360,000
Interest Rate
5.4%
Mortgage Type
New Conventional
Purchase Details
Closed on
Feb 5, 2002
Sold by
Sidhu Joginder Singh and Sidhu Charanjiv K
Bought by
Sidhu Joginder Singh
Purchase Details
Closed on
May 24, 1995
Sold by
Lightfoot Herbert C and Lightfoot Elizabeth J
Bought by
Sidhu Joginder Singh
Home Financials for this Owner
Home Financials are based on the most recent Mortgage that was taken out on this home.
Original Mortgage
$142,000
Interest Rate
7.34%
Mortgage Type
Seller Take Back
Create a Home Valuation Report for This Property
The Home Valuation Report is an in-depth analysis detailing your home's value as well as a comparison with similar homes in the area
Home Values in the Area
Average Home Value in this Area
Purchase History
| Date | Buyer | Sale Price | Title Company |
|---|---|---|---|
| Jcm Trust | -- | None Listed On Document | |
| Sidhu Charanjiv K | -- | Stewart Title Of California | |
| Sidhu Joginder Singh | -- | -- | |
| Sidhu Joginder Singh | $157,500 | Provident Title |
Source: Public Records
Mortgage History
| Date | Status | Borrower | Loan Amount |
|---|---|---|---|
| Previous Owner | Sidhu Charanjiv K | $360,000 | |
| Previous Owner | Sidhu Joginder Singh | $142,000 |
Source: Public Records
Tax History
| Year | Tax Paid | Tax Assessment Tax Assessment Total Assessment is a certain percentage of the fair market value that is determined by local assessors to be the total taxable value of land and additions on the property. | Land | Improvement |
|---|---|---|---|---|
| 2025 | $3,489 | $261,120 | $94,342 | $166,778 |
| 2024 | $3,489 | $256,001 | $92,493 | $163,508 |
| 2023 | $9,797 | $782,000 | $469,000 | $313,000 |
| 2022 | $3,279 | $246,061 | $88,902 | $157,159 |
| 2021 | $3,231 | $241,237 | $87,159 | $154,078 |
| 2019 | $3,141 | $234,084 | $84,575 | $149,509 |
| 2018 | $3,002 | $229,495 | $82,917 | $146,578 |
| 2016 | $2,852 | $220,586 | $79,699 | $140,887 |
| 2015 | $2,813 | $217,273 | $78,502 | $138,771 |
| 2014 | $2,830 | $213,018 | $76,965 | $136,053 |
Source: Public Records
Map
Nearby Homes
- 13435 Chase St
- 13509 Montague St
- 13568 Ottoman St
- 9024 Woodale Ave
- 8828 Zeiler Ave
- 13202 Wentworth St
- 13675 Rayen St
- 9327 Stanwin Ave
- 13100 Rangoon St
- 8759 Snowden Ave
- 13748 Sunburst St
- 13021 Crowley St
- 13052 Ottoman St
- 12966 Crowley St
- 9168 Vena Ave
- 13691 Kelowna St
- 13068 Mineola St
- 13400 Roscoe Blvd
- 9606 Lev Ave
- 13716 Goleta St
- 13468 Chase St
- 13500 Chase St
- 13462 Chase St
- 13506 Chase St
- 13455 Bracken St
- 13451 Bracken St
- 13461 Bracken St
- 13445 Bracken St
- 13463 Bracken St
- 13456 Chase St
- 13512 Chase St
- 13471 Chase St
- 13501 Chase St
- 13467 Chase St
- 13441 Bracken St
- 13469 Bracken St
- 13507 Chase St
- 13461 Chase St
- 13450 Chase St
- 13518 Chase St
Your Personal Tour Guide
Ask me questions while you tour the home.