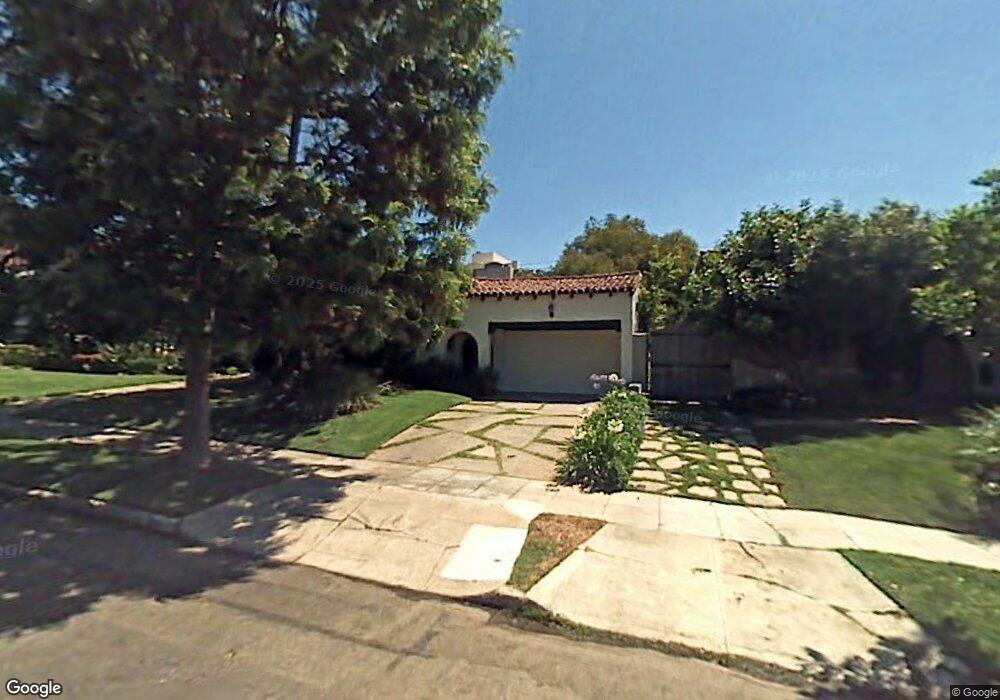
1348 Woodruff Ave Los Angeles, CA 90024
Westwood NeighborhoodEstimated Value: $2,221,000 - $2,583,000
3
Beds
2
Baths
1,752
Sq Ft
$1,360/Sq Ft
Est. Value
About This Home
This home is located at 1348 Woodruff Ave, Los Angeles, CA 90024 and is currently estimated at $2,383,060, approximately $1,360 per square foot. 1348 Woodruff Ave is a home located in Los Angeles County with nearby schools including Fairburn Avenue Elementary, Ralph Waldo Emerson Community Charter Middle School, and University High School Charter.
Ownership History
Date
Name
Owned For
Owner Type
Purchase Details
Closed on
Jul 30, 2009
Sold by
Henley Elizabeth
Bought by
Henley Elizabeth and Henley Living Trust Of 1997
Current Estimated Value
Home Financials for this Owner
Home Financials are based on the most recent Mortgage that was taken out on this home.
Original Mortgage
$417,000
Interest Rate
5.31%
Mortgage Type
New Conventional
Purchase Details
Closed on
Nov 20, 2008
Sold by
Henley Elizabeth
Bought by
Henley Elizabeth and The Henley Living Trust Of 1997
Home Financials for this Owner
Home Financials are based on the most recent Mortgage that was taken out on this home.
Original Mortgage
$417,000
Interest Rate
6.37%
Mortgage Type
New Conventional
Purchase Details
Closed on
Sep 29, 1997
Sold by
Henley Elizabeth B
Bought by
Henley Elizabeth and Henley Living Trust
Create a Home Valuation Report for This Property
The Home Valuation Report is an in-depth analysis detailing your home's value as well as a comparison with similar homes in the area
Home Values in the Area
Average Home Value in this Area
Purchase History
| Date | Buyer | Sale Price | Title Company |
|---|---|---|---|
| Henley Elizabeth | -- | None Available | |
| Henley Elizabeth | -- | Fidelity Van Nuys | |
| Henley Elizabeth | -- | None Available | |
| Henley Elizabeth | -- | Ticor Glendale | |
| Henley Elizabeth | -- | -- |
Source: Public Records
Mortgage History
| Date | Status | Borrower | Loan Amount |
|---|---|---|---|
| Closed | Henley Elizabeth | $417,000 | |
| Closed | Henley Elizabeth | $417,000 |
Source: Public Records
Tax History Compared to Growth
Tax History
| Year | Tax Paid | Tax Assessment Tax Assessment Total Assessment is a certain percentage of the fair market value that is determined by local assessors to be the total taxable value of land and additions on the property. | Land | Improvement |
|---|---|---|---|---|
| 2025 | $13,512 | $1,127,397 | $706,684 | $420,713 |
| 2024 | $13,512 | $1,105,292 | $692,828 | $412,464 |
| 2023 | $13,253 | $1,083,621 | $679,244 | $404,377 |
| 2022 | $12,639 | $1,062,375 | $665,926 | $396,449 |
| 2021 | $12,480 | $1,041,545 | $652,869 | $388,676 |
| 2019 | $12,106 | $1,010,654 | $633,505 | $377,149 |
| 2018 | $12,030 | $990,838 | $621,084 | $369,754 |
| 2016 | $11,504 | $952,364 | $596,967 | $355,397 |
| 2015 | $11,335 | $938,059 | $588,000 | $350,059 |
| 2014 | $11,373 | $919,684 | $576,482 | $343,202 |
Source: Public Records
Map
Nearby Homes
- 1361 S Beverly Glen Blvd
- 1333 S Beverly Glen Blvd Unit 901
- 1333 S Beverly Glen Blvd Unit 904
- 1333 S Beverly Glen Blvd Unit 703
- 1333 S Beverly Glen Blvd Unit 1006
- 1333 S Beverly Glen Blvd Unit 402
- 1301 S Beverly Glen Blvd
- 1360 S Beverly Glen Blvd
- 1325 Thayer Ave
- 1277 S Beverly Glen Blvd Unit 408
- 1501 Thayer Ave
- 10523 Ashton Ave Unit 301
- 10531 Ashton Ave Unit 201
- 10511 Ashton Ave Unit 101
- 10555 Ashton Ave Unit 201
- 1260 S Beverly Glen Blvd Unit 408
- 10509 Wilkins Ave
- 10321 Rochester Ave
- 10520 Wilshire Blvd Unit 1102
- 10520 Wilshire Blvd Unit 602
- 1342 Woodruff Ave
- 1352 Woodruff Ave
- 1349 Holmby Ave
- 1355 Holmby Ave
- 1343 Holmby Ave
- 1362 Woodruff Ave
- 1332 Woodruff Ave
- 1359 Holmby Ave
- 1339 Holmby Ave
- 1365 Holmby Ave
- 1365 Holmby Ave
- 1347 Woodruff Ave
- 1333 Holmby Ave
- 1368 Woodruff Ave
- 1328 Woodruff Ave
- 1341 Woodruff Ave
- 1357 Woodruff Ave
- 1369 Holmby Ave
- 1335 Woodruff Ave
- 1327 Holmby Ave