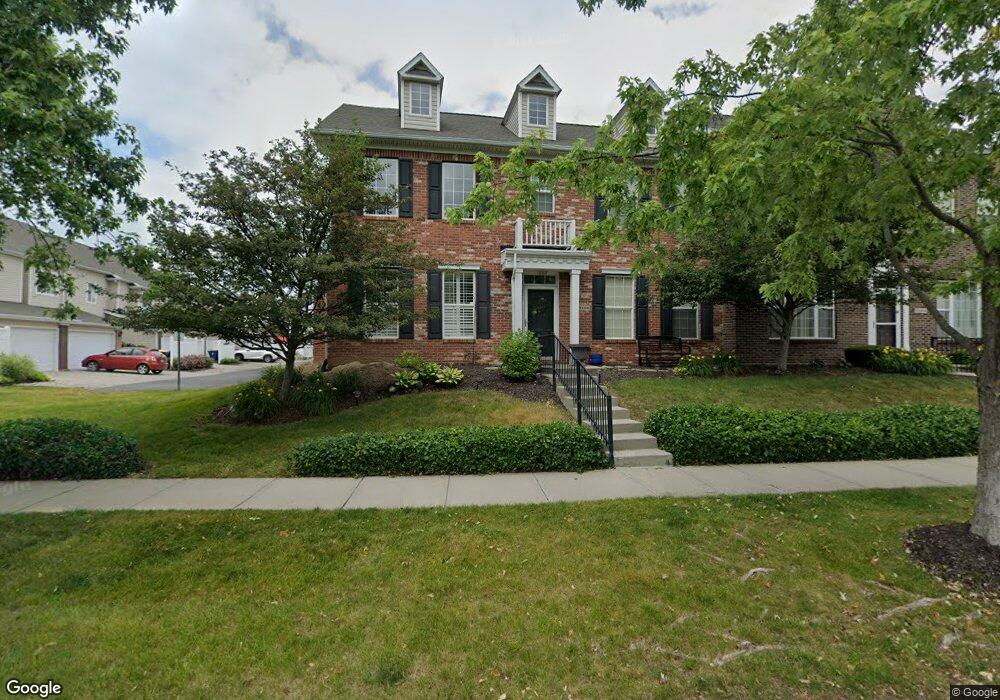
13486 E 131st St Fishers, IN 46037
Estimated Value: $321,570 - $329,000
3
Beds
3
Baths
2,140
Sq Ft
$152/Sq Ft
Est. Value
About This Home
This home is located at 13486 E 131st St, Fishers, IN 46037 and is currently estimated at $324,643, approximately $151 per square foot. 13486 E 131st St is a home located in Hamilton County with nearby schools including Thorpe Creek Elementary School, Hamilton Southeastern Intermediate / Junior High, and Hamilton Southeastern High School.
Ownership History
Date
Name
Owned For
Owner Type
Purchase Details
Closed on
Apr 2, 2020
Sold by
Snyder Vicki L and Gregg Julia H
Bought by
Hert Kevin and Hert Debra
Current Estimated Value
Home Financials for this Owner
Home Financials are based on the most recent Mortgage that was taken out on this home.
Original Mortgage
$196,000
Outstanding Balance
$173,632
Interest Rate
3.4%
Mortgage Type
VA
Estimated Equity
$151,011
Purchase Details
Closed on
Aug 11, 2018
Sold by
Spanner Alison D
Bought by
Snyder Vicki L and Snyder Julia H
Home Financials for this Owner
Home Financials are based on the most recent Mortgage that was taken out on this home.
Original Mortgage
$73,000
Interest Rate
4.5%
Mortgage Type
New Conventional
Purchase Details
Closed on
Sep 26, 2005
Sold by
Portrait Homes Hannover On The Green Llc
Bought by
Downs Joyce F
Create a Home Valuation Report for This Property
The Home Valuation Report is an in-depth analysis detailing your home's value as well as a comparison with similar homes in the area
Home Values in the Area
Average Home Value in this Area
Purchase History
| Date | Buyer | Sale Price | Title Company |
|---|---|---|---|
| Hert Kevin | -- | Ata National Title Group Llc | |
| Snyder Vicki L | -- | None Available | |
| Downs Joyce F | -- | Ctic Statesmen |
Source: Public Records
Mortgage History
| Date | Status | Borrower | Loan Amount |
|---|---|---|---|
| Open | Hert Kevin | $196,000 | |
| Previous Owner | Snyder Vicki L | $73,000 |
Source: Public Records
Tax History
| Year | Tax Paid | Tax Assessment Tax Assessment Total Assessment is a certain percentage of the fair market value that is determined by local assessors to be the total taxable value of land and additions on the property. | Land | Improvement |
|---|---|---|---|---|
| 2024 | $2,240 | $270,800 | $42,800 | $228,000 |
| 2023 | $2,240 | $261,900 | $42,800 | $219,100 |
| 2022 | $2,303 | $245,100 | $42,800 | $202,300 |
| 2021 | $2,083 | $228,600 | $42,800 | $185,800 |
| 2020 | $1,831 | $208,500 | $42,800 | $165,700 |
| 2019 | $2,314 | $201,800 | $37,000 | $164,800 |
| 2018 | $2,193 | $193,700 | $37,000 | $156,700 |
| 2017 | $2,357 | $201,800 | $37,000 | $164,800 |
| 2016 | $2,293 | $198,400 | $37,000 | $161,400 |
| 2014 | $2,118 | $197,700 | $43,100 | $154,600 |
| 2013 | $2,118 | $188,600 | $43,100 | $145,500 |
Source: Public Records
Map
Nearby Homes
- 13551 Erlen Dr
- 13311 Susser Way
- 13301 Minden Dr
- 13288 E Lieder Way
- 13276 E Lieder Way
- 13616 Whitten Dr N
- 12985 Saxony Blvd
- 13008 Overview Dr
- 12996 Overview Dr
- 13115 N Elster Way
- 13315 Patriotic Way
- 12957 E 131st St
- 12925 Old Glory Dr
- 12890 Old Glory Dr
- 12834 Piccadilly Cir
- 12880 Oxbridge Place
- 13533 Dewpoint Ln
- 12710 Courage Crossing
- 12694 Justice Crossing
- 12878 Ari Ln
- 13486 E 131st St Unit 1401
- 13492 E 131st St
- 13492 E 131st St Unit 14
- 13498 E 131st St
- 13135 Minden Dr
- 13147 Minden Dr
- 13147 Minden Dr Unit B
- 13487 Molique Blvd
- 13487 Molique Blvd Unit U
- 13487 Molique Blvd Unit D
- 13487 Molique Blvd Unit 1105
- 13159 Minden Dr
- 13159 Minden Dr Unit 201503
- 13159 Minden Dr Unit 1503
- 13493 Molique Blvd Unit 1104
- 13493 Molique Blvd
- 13171 Minden Dr
- 13499 Molique Blvd
- 13510 E 131st St
- 13510 E 131st St Unit 1405