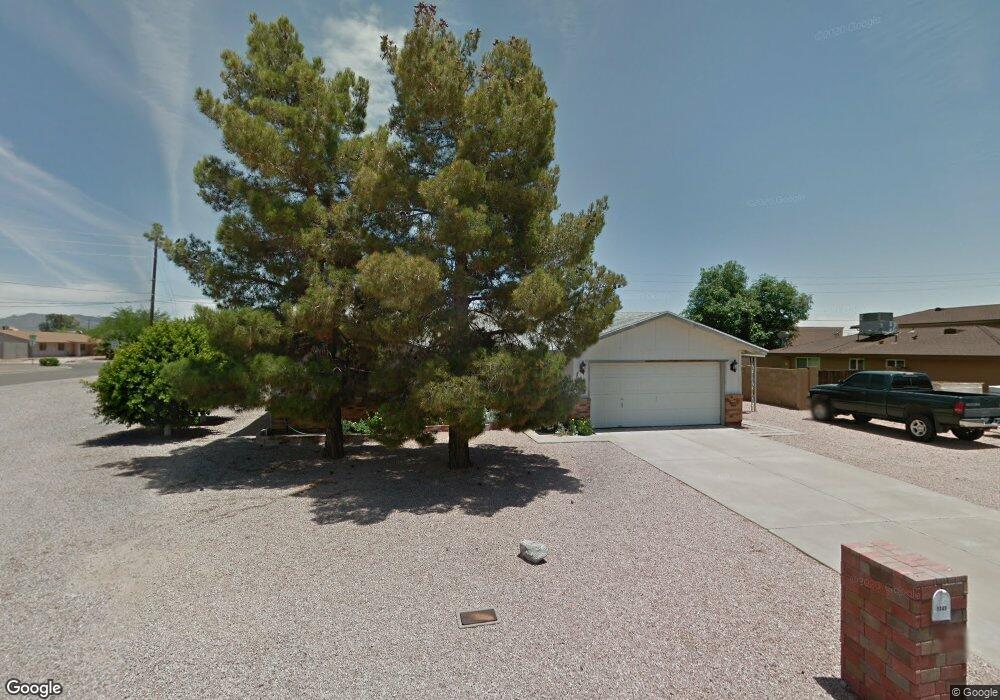
1349 N 66th St Mesa, AZ 85205
Central Mesa East NeighborhoodEstimated Value: $403,989 - $496,000
--
Bed
2
Baths
1,297
Sq Ft
$335/Sq Ft
Est. Value
About This Home
This home is located at 1349 N 66th St, Mesa, AZ 85205 and is currently estimated at $433,997, approximately $334 per square foot. 1349 N 66th St is a home located in Maricopa County with nearby schools including Falcon Hill Elementary School, Franklin at Brimhall Elementary School, and Franklin West Elementary School.
Ownership History
Date
Name
Owned For
Owner Type
Purchase Details
Closed on
Jul 12, 2023
Sold by
Riordan Donald Scott and Riordan Lorane E
Bought by
Riordan Family Trust and Riordan
Current Estimated Value
Purchase Details
Closed on
Mar 1, 2022
Sold by
Kay Tafoya Lisa
Bought by
Riordan Donald Scott and Riordan Lorane E
Home Financials for this Owner
Home Financials are based on the most recent Mortgage that was taken out on this home.
Original Mortgage
$320,000
Interest Rate
3.89%
Mortgage Type
New Conventional
Purchase Details
Closed on
Sep 17, 2005
Sold by
Ginter Sharon Kay and Ibach Sharon K
Bought by
Ginter Sharon Kay
Purchase Details
Closed on
Jan 21, 1999
Sold by
Jacques David A and Jacques Denise M
Bought by
Ibach Sharon K
Create a Home Valuation Report for This Property
The Home Valuation Report is an in-depth analysis detailing your home's value as well as a comparison with similar homes in the area
Home Values in the Area
Average Home Value in this Area
Purchase History
| Date | Buyer | Sale Price | Title Company |
|---|---|---|---|
| Riordan Family Trust | -- | None Listed On Document | |
| Riordan Donald Scott | $400,000 | None Listed On Document | |
| Ginter Sharon Kay | -- | -- | |
| Ibach Sharon K | $105,000 | Nations Title Insurance |
Source: Public Records
Mortgage History
| Date | Status | Borrower | Loan Amount |
|---|---|---|---|
| Previous Owner | Riordan Donald Scott | $320,000 |
Source: Public Records
Tax History Compared to Growth
Tax History
| Year | Tax Paid | Tax Assessment Tax Assessment Total Assessment is a certain percentage of the fair market value that is determined by local assessors to be the total taxable value of land and additions on the property. | Land | Improvement |
|---|---|---|---|---|
| 2025 | $1,391 | $16,744 | -- | -- |
| 2024 | $1,406 | $15,947 | -- | -- |
| 2023 | $1,406 | $31,900 | $6,380 | $25,520 |
| 2022 | $1,375 | $24,100 | $4,820 | $19,280 |
| 2021 | $1,413 | $21,630 | $4,320 | $17,310 |
| 2020 | $1,394 | $20,270 | $4,050 | $16,220 |
| 2019 | $1,291 | $18,150 | $3,630 | $14,520 |
| 2018 | $1,233 | $15,780 | $3,150 | $12,630 |
| 2017 | $1,194 | $14,930 | $2,980 | $11,950 |
| 2016 | $1,172 | $12,970 | $2,590 | $10,380 |
| 2015 | $1,107 | $12,100 | $2,420 | $9,680 |
Source: Public Records
Map
Nearby Homes
- 1216 N 66th Place
- 6720 E Encanto St Unit 20
- 6245 E Brown Rd
- 1739 N Silverado
- 6205 E Ivy St
- 6917 E Ingram Cir
- 6961 E Ivyglen St
- 6420 E Jensen St
- 7114 E Grandview St
- 1735 N Platina Cir
- 6360 E Ensenada St
- 6505 E El Paso St
- 6416 E El Paso St
- 6048 E Hobart St
- 6531 E June St
- 6042 E Halifax St
- 1951 N 64th St Unit 51
- 1951 N 64th St Unit 55
- 6102 E Fairfield St
- 6646 E Dodge St
- 1337 N 66th St
- 1346 N 66th Place
- 6555 E Princess Dr
- 1404 N 66th Place
- 6602 E Princess Dr
- 1325 N 66th St
- 1342 N 66th St
- 1328 N 66th Place
- 6629 E Princess Dr
- 6546 E Princess Dr
- 6626 E Princess Dr
- 1414 N 66th Place
- 1341 N 66th Place
- 6521 E Princess Dr
- 1322 N 66th St
- 1313 N 66th St
- 6545 E Halifax Dr
- 1316 N 66th Place
- 1331 N 65th Place
- 1331 N 66th Place