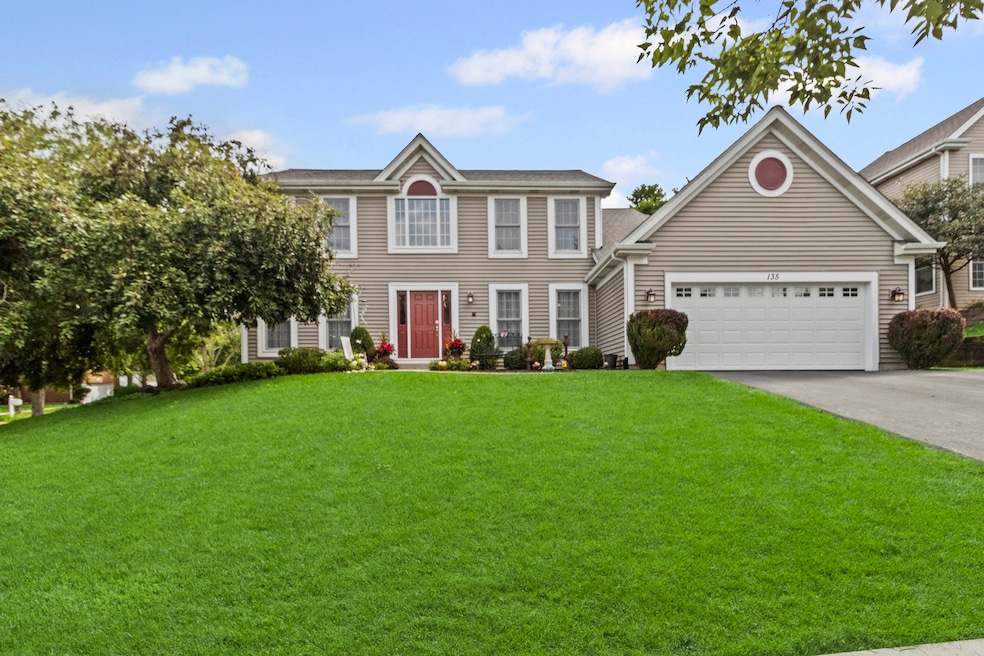


135 Arquilla Dr Algonquin, IL 60102
Estimated payment $3,092/month
Highlights
- Recreation Room
- Workshop
- Living Room
- Harry D Jacobs High School Rated A-
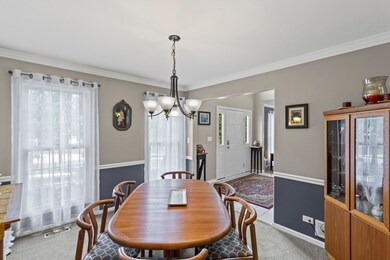
- Formal Dining Room
- Laundry Room
About This Home
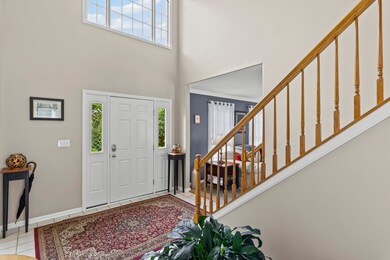
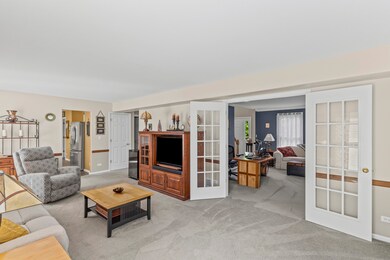
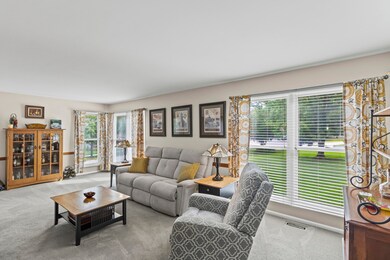
Welcome to 135 Arquilla Drive, a 4-bedroom, 2.5-bath home that blends comfort, style, and thoughtful updates. From the moment you enter, the natural flow and inviting layout set the stage for easy living. The whole kitchen was done in 2018 and shines with recent upgrades: refrigerator (2023), range (2024), and dishwasher (2025). Gilkey sliding door with lifetime warranty leads onto the patio. Upstairs, four spacious bedrooms provide room to unwind, with the primary suite offering a private retreat. Bathrooms are practical yet charming, perfectly balancing function and comfort. This home has been carefully maintained: roof and siding (2010), front entry door (2022), and driveway seal (2024) mean peace of mind for years ahead. Ample storage in unfurnished basement area, large closets and garage attic. Two car garage is extra wide and includes a large storage area in front of the cars. Outside, the welcoming yard is ideal for play, gardening, or simply enjoying a quiet cup of coffee. Whether gathering with loved ones or finding a moment of solitude, this home offers the perfect setting. 135 Arquilla Drive isn't just a house-it's a place where memories are waiting to be made.
Home Details
Home Type
- Single Family
Est. Annual Taxes
- $8,733
Year Built
- Built in 1994
Parking
- 2 Car Garage
- Driveway
- Off-Street Parking
- Parking Included in Price
Home Design
- Concrete Perimeter Foundation
Interior Spaces
- 2,335 Sq Ft Home
- 2-Story Property
- Family Room
- Living Room
- Formal Dining Room
- Recreation Room
- Workshop
- Utility Room with Study Area
- Laundry Room
- Carpet
- Basement Fills Entire Space Under The House
Bedrooms and Bathrooms
- 4 Bedrooms
- 4 Potential Bedrooms
Schools
- Lincoln Prairie Elementary Schoo
- Westfield Community Middle School
- H D Jacobs High School
Utilities
- Central Air
- Heating System Uses Natural Gas
- Lake Michigan Water
Listing and Financial Details
- Homeowner Tax Exemptions
Map
Home Values in the Area
Average Home Value in this Area
Tax History
| Year | Tax Paid | Tax Assessment Tax Assessment Total Assessment is a certain percentage of the fair market value that is determined by local assessors to be the total taxable value of land and additions on the property. | Land | Improvement |
|---|---|---|---|---|
| 2024 | $8,733 | $127,643 | $27,377 | $100,266 |
| 2023 | $8,217 | $114,160 | $24,485 | $89,675 |
| 2022 | $8,925 | $115,068 | $29,200 | $85,868 |
| 2021 | $8,980 | $107,199 | $27,203 | $79,996 |
| 2020 | $8,746 | $103,404 | $26,240 | $77,164 |
| 2019 | $8,537 | $98,970 | $25,115 | $73,855 |
| 2018 | $8,143 | $91,427 | $23,201 | $68,226 |
| 2017 | $7,979 | $86,130 | $21,857 | $64,273 |
| 2016 | $7,864 | $80,782 | $20,500 | $60,282 |
| 2013 | -- | $76,441 | $19,124 | $57,317 |
Property History
| Date | Event | Price | List to Sale | Price per Sq Ft |
|---|---|---|---|---|
| 10/23/2025 10/23/25 | Pending | -- | -- | -- |
| 10/01/2025 10/01/25 | Price Changed | $449,000 | -4.3% | $192 / Sq Ft |
| 09/19/2025 09/19/25 | For Sale | $469,000 | -- | $201 / Sq Ft |
Purchase History
| Date | Type | Sale Price | Title Company |
|---|---|---|---|
| Warranty Deed | -- | None Listed On Document | |
| Interfamily Deed Transfer | -- | Residential Title Services | |
| Warranty Deed | $210,000 | -- |
Mortgage History
| Date | Status | Loan Amount | Loan Type |
|---|---|---|---|
| Previous Owner | $203,200 | New Conventional | |
| Previous Owner | $115,000 | No Value Available |
Source: Midwest Real Estate Data (MRED)
MLS Number: 12476758
APN: 19-29-426-022
Disclaimer: Certain information contained herein is derived from information provided by parties other than Homes.com. All information provided is deemed reliable, but is not guaranteed to be accurate and should be independently verified.
![]() Based on information submitted to the MLS GRID. All data is obtained from various sources and may not have been verified by broker or MLS GRID. Supplied Open House Information is subject to change without notice. All information should be independently reviewed and verified for accuracy. Properties may or may not be listed by the office/agent presenting the information. Some IDX listings have been excluded from this website.
Based on information submitted to the MLS GRID. All data is obtained from various sources and may not have been verified by broker or MLS GRID. Supplied Open House Information is subject to change without notice. All information should be independently reviewed and verified for accuracy. Properties may or may not be listed by the office/agent presenting the information. Some IDX listings have been excluded from this website.
The Digital Millennium Copyright Act of 1998, 17 U.S.C. § 512 (the “DMCA”) provides recourse for copyright owners who believe that material appearing on the Internet infringes their rights under U.S. copyright law. If you believe in good faith that any content or material made available in connection with our website or services infringes your copyright, you (or your agent) may send us a notice requesting that the content or material be removed, or access to it blocked.
Notices must be sent in writing by email to DMCAnotice@MLSGrid.com.
The DMCA requires that your notice of alleged copyright infringement include the following information:
(1) description of the copyrighted work that is the subject of claimed infringement;
(2) description of the alleged infringing content and information sufficient to permit us to locate the content;
(3) contact information for you, including your address, telephone number and email address;
(4) a statement by you that you have a good faith belief that the content in the manner complained of is not authorized by the copyright owner, or its agent, or by the operation of any law;
(5) a statement by you, signed under penalty of perjury, that the information in the notification is accurate and that you have the authority to enforce the copyrights that are claimed to be infringed; and
(6) a physical or electronic signature of the copyright owner or a person authorized to act on the copyright owner’s behalf. Failure to include all of the above information may result in the delay of the processing of your complaint.
- Lots 10 & 11 Ramble Rd
- 305 Buckingham Dr
- LOT 3 Blackhawk Dr
- 113 Pheasant Trail
- 266 Grandview Ct
- 16 Brian Ct
- 909 Roger St
- 101 Oakleaf Rd
- 700 Fairfield Ln
- 807 Menominee Dr
- 809 Menominee Dr
- 1235 Fairmont Ct
- 70 Hilltop Dr Unit 4
- 661 Majestic Dr
- 212 Village Creek Dr
- 1019 Maple St
- 275 Indian Trail
- 900 Windstone Ct
- 741 Regal Ln
- 1820 Crofton Dr
