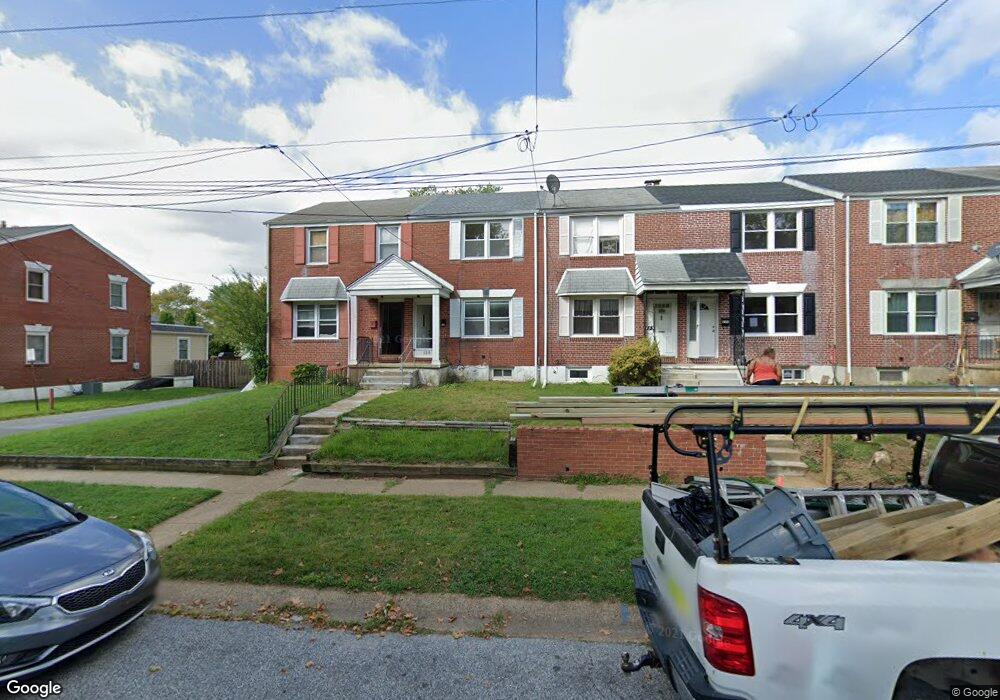
135 Birch Ave Wilmington, DE 19805
Estimated Value: $189,000 - $222,000
About This Home
This home is located at 135 Birch Ave, Wilmington, DE 19805 and is currently estimated at $204,169, approximately $212 per square foot. 135 Birch Ave is a home located in New Castle County with nearby schools including Austin D. Baltz Elementary School, Alexis I. du Pont Middle School, and Thomas McKean High School.
Ownership History
We collect this data history from publicly available records. To have your information removed, we recommend requesting removal directly through your county’s website.
Purchase Details
Purchase Details
Purchase Details
Home Financials for this Owner
Home Financials are based on the most recent Mortgage that was taken out on this home.Purchase Details
Home Financials for this Owner
Home Financials are based on the most recent Mortgage that was taken out on this home.Purchase Details
Home Values in the Area
Average Home Value in this Area
Purchase History
We collect this data history from publicly available records. To have your information removed, we recommend requesting removal directly through your county’s website.
| Date | Buyer | Sale Price | Title Company |
|---|---|---|---|
| -- | None Available | ||
| $150,000 | Attorney | ||
| $125,000 | None Available | ||
| $56,001 | -- | ||
| $41,300 | -- |
Mortgage History
We collect this data history from publicly available records. To have your information removed, we recommend requesting removal directly through your county’s website.
| Date | Status | Borrower | Loan Amount |
|---|---|---|---|
| Previous Owner | $112,500 | ||
| Previous Owner | $47,600 |
Tax History
We collect this data history from publicly available records. To have your information removed, we recommend requesting removal directly through your county’s website.
| Year | Tax Paid | Tax Assessment Tax Assessment Total Assessment is a certain percentage of the fair market value that is determined by local assessors to be the total taxable value of land and additions on the property. | Land | Improvement |
|---|---|---|---|---|
| 2025 | $1,491 | $211,100 | $42,900 | $168,200 |
| 2024 | $1,161 | $35,400 | $7,100 | $28,300 |
| 2023 | $1,012 | $35,400 | $7,100 | $28,300 |
| 2022 | $1,012 | $35,400 | $7,100 | $28,300 |
| 2021 | $984 | $35,400 | $7,100 | $28,300 |
| 2020 | $990 | $35,400 | $7,100 | $28,300 |
| 2019 | $1,216 | $35,400 | $7,100 | $28,300 |
| 2018 | $50 | $35,400 | $7,100 | $28,300 |
| 2017 | $946 | $35,400 | $7,100 | $28,300 |
| 2016 | $946 | $35,400 | $7,100 | $28,300 |
| 2015 | -- | $35,400 | $7,100 | $28,300 |
| 2014 | $803 | $35,400 | $7,100 | $28,300 |
Map
- 154 Linden Ave
- 227 Birch Ave
- 918 New Rd
- 930 Dover Ave
- 117 Alvil Rd
- 6 Vilone Place
- 20 Poplar Ave
- 112 Olga Rd
- 33 Richard Ave
- 100 Washington Ave
- 100 Forrest Ave
- 1504 Old Farm Rd
- 303 Osborne Rd
- 1411 Wedgewood Rd
- 67 Norway Ave
- 118 Matthes Ave
- 1313 Idlewood Rd
- 1317 Idlewood Rd
- 407 W Summit Ave
- 301 Howard St
Ask me questions while you tour the home.