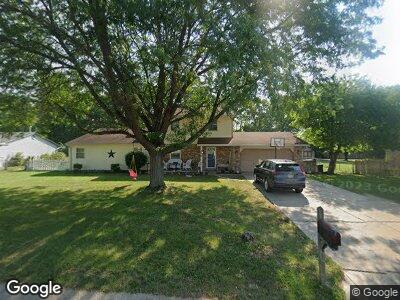
135 Charles Dr Franklin, OH 45005
Estimated Value: $287,000 - $353,000
3
Beds
2
Baths
2,528
Sq Ft
$122/Sq Ft
Est. Value
About This Home
This home is located at 135 Charles Dr, Franklin, OH 45005 and is currently estimated at $307,509, approximately $121 per square foot. 135 Charles Dr is a home located in Warren County with nearby schools including Alden R Brown Elementary School, Chamberlain Middle School, and Carlisle High School.
Ownership History
Date
Name
Owned For
Owner Type
Purchase Details
Closed on
Feb 26, 2016
Sold by
Maugans Veronica R
Bought by
Maugans Matthew W
Current Estimated Value
Purchase Details
Closed on
Aug 29, 1996
Sold by
Bowling Jejjrey A
Bought by
Maugans Matthew W and Maugans Veronica R
Home Financials for this Owner
Home Financials are based on the most recent Mortgage that was taken out on this home.
Original Mortgage
$70,000
Interest Rate
8.5%
Mortgage Type
New Conventional
Purchase Details
Closed on
Dec 1, 1989
Sold by
Smith Smith and Smith Hershel
Bought by
Bowling Bowling and Bowling Jeffrey A
Purchase Details
Closed on
Jun 14, 1989
Sold by
Gross James L and Gross Ross
Bought by
Smith and Smith Hershel
Purchase Details
Closed on
Mar 6, 1989
Sold by
Gross Gross and Gross James Lsr
Bought by
Gross Gross and Gross James L
Create a Home Valuation Report for This Property
The Home Valuation Report is an in-depth analysis detailing your home's value as well as a comparison with similar homes in the area
Home Values in the Area
Average Home Value in this Area
Purchase History
| Date | Buyer | Sale Price | Title Company |
|---|---|---|---|
| Maugans Matthew W | $16,667 | Attorney | |
| Maugans Matthew W | $110,000 | -- | |
| Bowling Bowling | $84,900 | -- | |
| Smith | $14,500 | -- | |
| Gross Gross | -- | -- |
Source: Public Records
Mortgage History
| Date | Status | Borrower | Loan Amount |
|---|---|---|---|
| Open | Maugans Matthew W | $157,250 | |
| Closed | Maugans Matthew W | $8,000 | |
| Closed | Maugans Matthew W | $70,000 |
Source: Public Records
Tax History Compared to Growth
Tax History
| Year | Tax Paid | Tax Assessment Tax Assessment Total Assessment is a certain percentage of the fair market value that is determined by local assessors to be the total taxable value of land and additions on the property. | Land | Improvement |
|---|---|---|---|---|
| 2024 | $3,156 | $82,370 | $19,250 | $63,120 |
| 2023 | $2,669 | $62,930 | $11,812 | $51,117 |
| 2022 | $2,651 | $62,930 | $11,813 | $51,118 |
| 2021 | $2,560 | $62,930 | $11,813 | $51,118 |
| 2020 | $2,345 | $50,344 | $9,450 | $40,894 |
| 2019 | $2,379 | $50,344 | $9,450 | $40,894 |
| 2018 | $2,663 | $50,344 | $9,450 | $40,894 |
| 2017 | $2,405 | $46,925 | $8,953 | $37,972 |
| 2016 | $2,100 | $46,925 | $8,953 | $37,972 |
| 2015 | $2,107 | $46,925 | $8,953 | $37,972 |
| 2014 | $2,622 | $45,560 | $8,690 | $36,870 |
| 2013 | $2,024 | $55,040 | $10,500 | $44,540 |
Source: Public Records
Map
Nearby Homes
- 1070 Dubois Rd
- 5506 Glen Ct
- 10 Timber Creek Ct
- 30 Timber Creek Dr
- 20 Timber Creek Dr
- 1227 Waterbury Dr
- 1213 Waterbury Dr
- 1605 Ashbury Ct
- 7702 Gayle Dr
- 1019 Marty Lee Ln
- 8588 Twincreek Dr
- 533 Clay St
- 120 Cousins Dr
- 1320 Ellington Ct
- 479 E Lomar Ave
- 7901 Timberview Ct
- 1213 Waterbury Dr
- 1419 Edinburg Ct
- 135 Charles Dr
- 145 Charles Dr
- 125 Charles Dr
- 765 Robert Place
- 757 Robert Place
- 155 Charles Dr
- 140 Charles Dr
- 195 Vernon Place
- 115 Charles Dr
- 773 Robert Place
- 749 Robert Place
- 150 Charles Dr
- 165 Charles Dr
- 1000 Dubois Rd
- 781 Robert Place
- 160 Charles Dr
- 741 Robert Place
- 185 Vernon Place
- 190 Vernon Place
- 175 Charles Dr