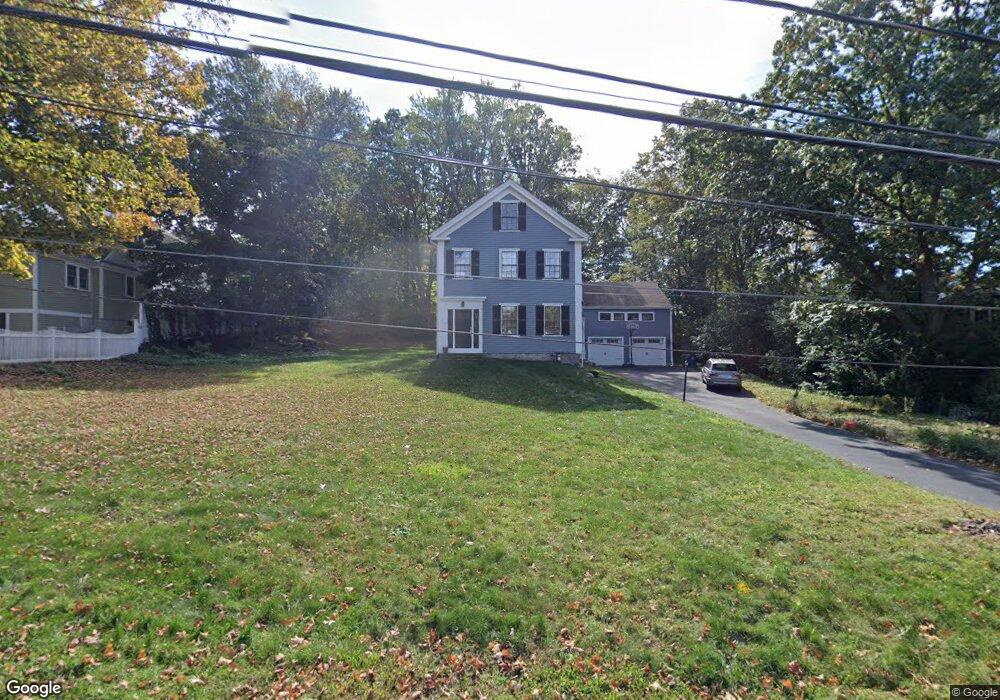
135 Cornell St Newton Lower Falls, MA 02462
Newton Lower Falls NeighborhoodEstimated Value: $1,447,000 - $2,204,000
4
Beds
2
Baths
2,105
Sq Ft
$913/Sq Ft
Est. Value
About This Home
This home is located at 135 Cornell St, Newton Lower Falls, MA 02462 and is currently estimated at $1,922,770, approximately $913 per square foot. 135 Cornell St is a home located in Middlesex County with nearby schools including Angier Elementary School, Charles E Brown Middle School, and Newton South High School.
Ownership History
Date
Name
Owned For
Owner Type
Purchase Details
Closed on
May 1, 2008
Sold by
Jessup David S and Jessup Gail W
Bought by
Connor John J and Connor Rebecca F
Current Estimated Value
Home Financials for this Owner
Home Financials are based on the most recent Mortgage that was taken out on this home.
Original Mortgage
$417,000
Outstanding Balance
$265,600
Interest Rate
5.99%
Mortgage Type
Purchase Money Mortgage
Estimated Equity
$1,657,170
Create a Home Valuation Report for This Property
The Home Valuation Report is an in-depth analysis detailing your home's value as well as a comparison with similar homes in the area
Home Values in the Area
Average Home Value in this Area
Purchase History
| Date | Buyer | Sale Price | Title Company |
|---|---|---|---|
| Connor John J | $605,000 | -- |
Source: Public Records
Mortgage History
| Date | Status | Borrower | Loan Amount |
|---|---|---|---|
| Open | Connor John J | $417,000 |
Source: Public Records
Tax History Compared to Growth
Tax History
| Year | Tax Paid | Tax Assessment Tax Assessment Total Assessment is a certain percentage of the fair market value that is determined by local assessors to be the total taxable value of land and additions on the property. | Land | Improvement |
|---|---|---|---|---|
| 2025 | $16,943 | $1,728,900 | $1,059,400 | $669,500 |
| 2024 | $16,373 | $1,677,600 | $1,028,500 | $649,100 |
| 2023 | $15,461 | $1,518,800 | $821,400 | $697,400 |
| 2022 | $14,794 | $1,406,300 | $760,600 | $645,700 |
| 2021 | $14,275 | $1,326,700 | $717,500 | $609,200 |
| 2020 | $13,851 | $1,326,700 | $717,500 | $609,200 |
| 2019 | $11,260 | $1,077,500 | $696,600 | $380,900 |
| 2018 | $10,575 | $977,400 | $612,700 | $364,700 |
| 2017 | $10,254 | $922,100 | $578,000 | $344,100 |
| 2016 | $9,807 | $861,800 | $540,200 | $321,600 |
| 2015 | $9,351 | $805,400 | $504,900 | $300,500 |
Source: Public Records
Map
Nearby Homes
- 45 Moulton St
- 17 Deforest Rd
- 25 Columbia St
- 2084 Washington St
- 45 E Quinobequin Rd
- 7 Crescent St
- 34 Palmer Rd
- 177 Varick Rd
- 2 Longfellow Rd
- 10 Lorraine Cir
- 27 Oakwood Rd
- 12 Bird Hill Ave
- 10 Bird Hill Ave
- 33 Metacomet Rd
- 8 Old Town Rd
- 1801 Beacon St
- 17 Lasell St
- 135 Orchard Ave
- 20 Oakland Street Front
- 41 Orchard Ave