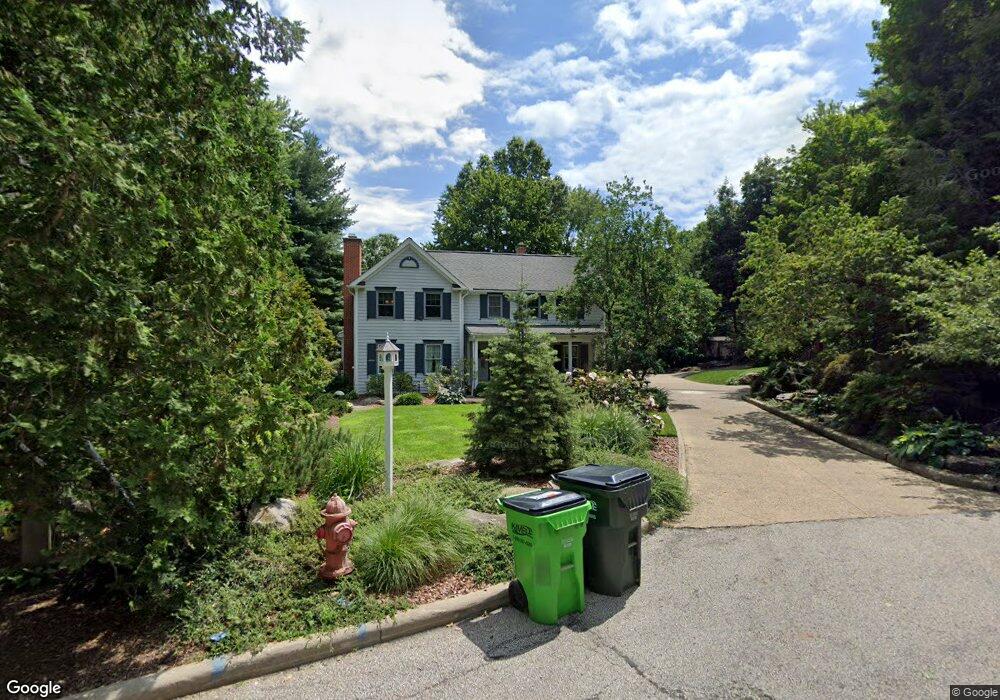
135 May Ct Chagrin Falls, OH 44022
Estimated Value: $543,472 - $661,000
3
Beds
4
Baths
1,946
Sq Ft
$315/Sq Ft
Est. Value
About This Home
This home is located at 135 May Ct, Chagrin Falls, OH 44022 and is currently estimated at $613,618, approximately $315 per square foot. 135 May Ct is a home located in Cuyahoga County with nearby schools including Gurney Elementary School, Chagrin Falls Intermediate Elementary School, and Chagrin Falls Middle School.
Ownership History
Date
Name
Owned For
Owner Type
Purchase Details
Closed on
Jan 31, 2002
Sold by
Seager Donald P and Seager Susan B
Bought by
Seager Donald F and Seager Susan
Current Estimated Value
Home Financials for this Owner
Home Financials are based on the most recent Mortgage that was taken out on this home.
Original Mortgage
$160,000
Interest Rate
7.11%
Create a Home Valuation Report for This Property
The Home Valuation Report is an in-depth analysis detailing your home's value as well as a comparison with similar homes in the area
Home Values in the Area
Average Home Value in this Area
Purchase History
| Date | Buyer | Sale Price | Title Company |
|---|---|---|---|
| Seager Donald F | -- | -- |
Source: Public Records
Mortgage History
| Date | Status | Borrower | Loan Amount |
|---|---|---|---|
| Closed | Seager Donald F | $160,000 | |
| Closed | Seager Donald F | $49,000 |
Source: Public Records
Tax History
| Year | Tax Paid | Tax Assessment Tax Assessment Total Assessment is a certain percentage of the fair market value that is determined by local assessors to be the total taxable value of land and additions on the property. | Land | Improvement |
|---|---|---|---|---|
| 2025 | $10,218 | $164,150 | $64,890 | $99,260 |
| 2024 | $10,333 | $164,150 | $64,890 | $99,260 |
| 2023 | $10,647 | $146,550 | $48,340 | $98,210 |
| 2022 | $11,265 | $146,550 | $48,340 | $98,210 |
| 2021 | $11,223 | $146,550 | $48,340 | $98,210 |
| 2020 | $10,759 | $129,680 | $42,770 | $86,910 |
| 2019 | $10,613 | $370,500 | $122,200 | $248,300 |
| 2018 | $5,278 | $129,680 | $42,770 | $86,910 |
| 2017 | $9,890 | $114,940 | $35,910 | $79,030 |
| 2016 | $8,905 | $114,940 | $35,910 | $79,030 |
| 2015 | $8,238 | $114,940 | $35,910 | $79,030 |
| 2014 | $8,238 | $104,480 | $32,660 | $71,820 |
Source: Public Records
Map
Nearby Homes
- 110 Emilia Ct
- 207 S Main St
- 213 S Main St
- 219 S Main St
- 225 S Main St
- 40 Highland Ln
- 26 Water St
- 81 Hall St
- 106 W Washington St
- 106 Solon Rd
- 270 North St
- 315 Solon Rd Unit 309
- 0 Bell Rd
- S/L Rocker Ave
- 318 Hillside Ln
- 145 Greenbrier Dr
- 16690 Dayton St
- 7202 Woodland Ave
- 16788 Geneva St
- 7650 Blackford Dr
Your Personal Tour Guide
Ask me questions while you tour the home.