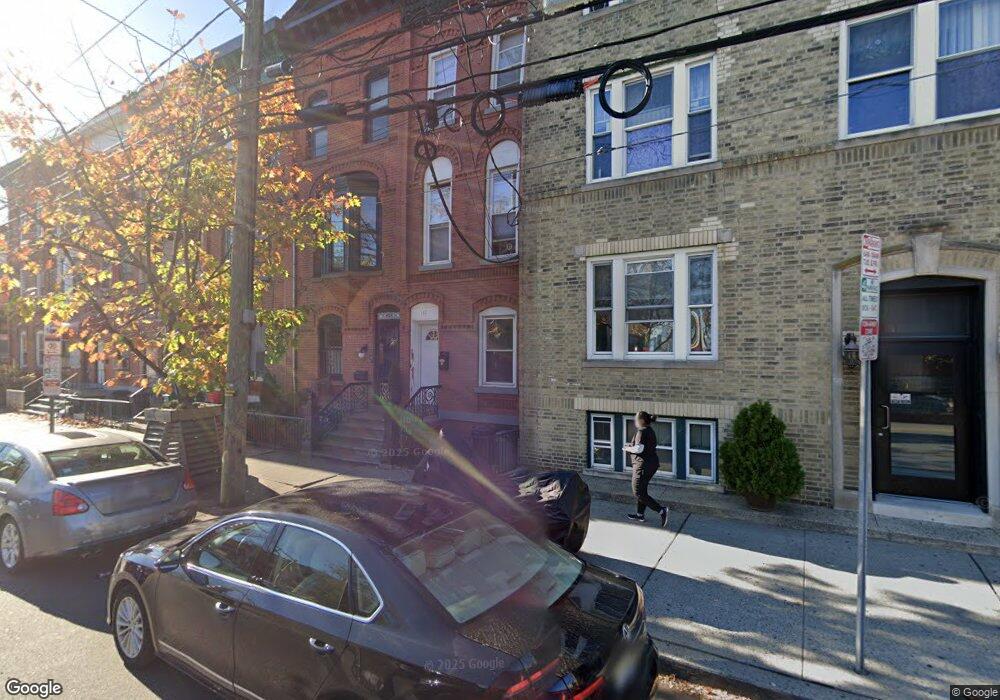
135 Palisade Ave Jersey City, NJ 07306
The Heights NeighborhoodEstimated Value: $758,271 - $821,000
3
Beds
2
Baths
1,764
Sq Ft
$448/Sq Ft
Est. Value
About This Home
This home is located at 135 Palisade Ave, Jersey City, NJ 07306 and is currently estimated at $790,318, approximately $448 per square foot. 135 Palisade Ave is a home located in Hudson County with nearby schools including Jotham W. Wakeman No. 6 Elementary School, William L. Dickinson High School, and Dr Ronald McNair High School.
Ownership History
Date
Name
Owned For
Owner Type
Purchase Details
Closed on
Jan 12, 2004
Sold by
Blost Richard and Blost Laura
Bought by
Karpowicz Angela and Schwartz Michael
Current Estimated Value
Home Financials for this Owner
Home Financials are based on the most recent Mortgage that was taken out on this home.
Original Mortgage
$280,000
Outstanding Balance
$130,763
Interest Rate
5.88%
Mortgage Type
Stand Alone First
Estimated Equity
$659,555
Purchase Details
Closed on
Jul 26, 2001
Sold by
Abrams Lidia Dengelegi
Bought by
Blost Richard Lee and Blost Laura Lee
Home Financials for this Owner
Home Financials are based on the most recent Mortgage that was taken out on this home.
Original Mortgage
$152,800
Interest Rate
7.16%
Purchase Details
Closed on
Jan 28, 1994
Sold by
Goodman Julia
Bought by
Dengelegi Lidia
Home Financials for this Owner
Home Financials are based on the most recent Mortgage that was taken out on this home.
Original Mortgage
$126,000
Interest Rate
7.12%
Create a Home Valuation Report for This Property
The Home Valuation Report is an in-depth analysis detailing your home's value as well as a comparison with similar homes in the area
Home Values in the Area
Average Home Value in this Area
Purchase History
| Date | Buyer | Sale Price | Title Company |
|---|---|---|---|
| Karpowicz Angela | $362,000 | -- | |
| Blost Richard Lee | $191,000 | -- | |
| Dengelegi Lidia | $157,000 | -- |
Source: Public Records
Mortgage History
| Date | Status | Borrower | Loan Amount |
|---|---|---|---|
| Open | Karpowicz Angela | $280,000 | |
| Previous Owner | Blost Richard Lee | $152,800 | |
| Previous Owner | Dengelegi Lidia | $126,000 |
Source: Public Records
Tax History Compared to Growth
Tax History
| Year | Tax Paid | Tax Assessment Tax Assessment Total Assessment is a certain percentage of the fair market value that is determined by local assessors to be the total taxable value of land and additions on the property. | Land | Improvement |
|---|---|---|---|---|
| 2025 | $7,916 | $354,500 | $145,800 | $208,700 |
| 2024 | $7,966 | $354,500 | $145,800 | $208,700 |
| 2023 | $7,966 | $354,500 | $145,800 | $208,700 |
| 2022 | $7,508 | $354,500 | $145,800 | $208,700 |
| 2021 | $5,686 | $354,500 | $145,800 | $208,700 |
| 2020 | $5,707 | $354,500 | $145,800 | $208,700 |
| 2019 | $5,459 | $354,500 | $145,800 | $208,700 |
| 2018 | $1,475 | $354,500 | $145,800 | $208,700 |
| 2017 | $7,730 | $99,100 | $9,200 | $89,900 |
| 2016 | $7,632 | $99,100 | $9,200 | $89,900 |
| 2015 | $7,415 | $99,100 | $9,200 | $89,900 |
| 2014 | $7,367 | $99,100 | $9,200 | $89,900 |
Source: Public Records
Map
Nearby Homes
- 137 Palisade Ave
- 34 Concord St
- 25 Saint Pauls Ave Unit 3
- 97 Palisade Ave
- 108 Palisade Ave Unit A5
- 21 Concord St Unit 2
- 85 Palisade Ave
- 28 Beacon Ave Unit 3
- 28 Beacon Ave Unit 1
- 28 Beacon Ave Unit 2
- 41 Beacon Ave Unit 2
- 41 Beacon Ave Unit 1
- 40 Beacon Ave
- 10 Concord St
- 396 Baldwin Ave
- 60 Hopkins Ave
- 34 Laidlaw Ave
- 65 Fleet St Unit 403
- 69 Beacon Ave
- 348 Baldwin Ave Unit 402
- 131 Palisade Ave
- 131 Palisade Ave Unit 2
- 133 Palisade Ave
- 133 Palisade Ave Unit 1
- 8 Saint Pauls Ave Unit 3L
- 8 Saint Pauls Ave
- 141 Palisade Ave Unit 12
- 141 Palisade Ave
- 141 Palisade Ave Unit 11
- 141 Palisade Ave Unit 7
- 141 Palisade Ave Unit 4
- 141 Palisade Ave Unit 1
- 145 Palisade Ave
- 145 Palisade Ave Unit 2
- 14 Saint Pauls Ave
- 125 Palisade Ave
- 125 Palisade Ave Unit 3
- 125 Palisade Ave Unit 2
- 125 Palisade Ave Unit 1
- 9 Hopkins Ave