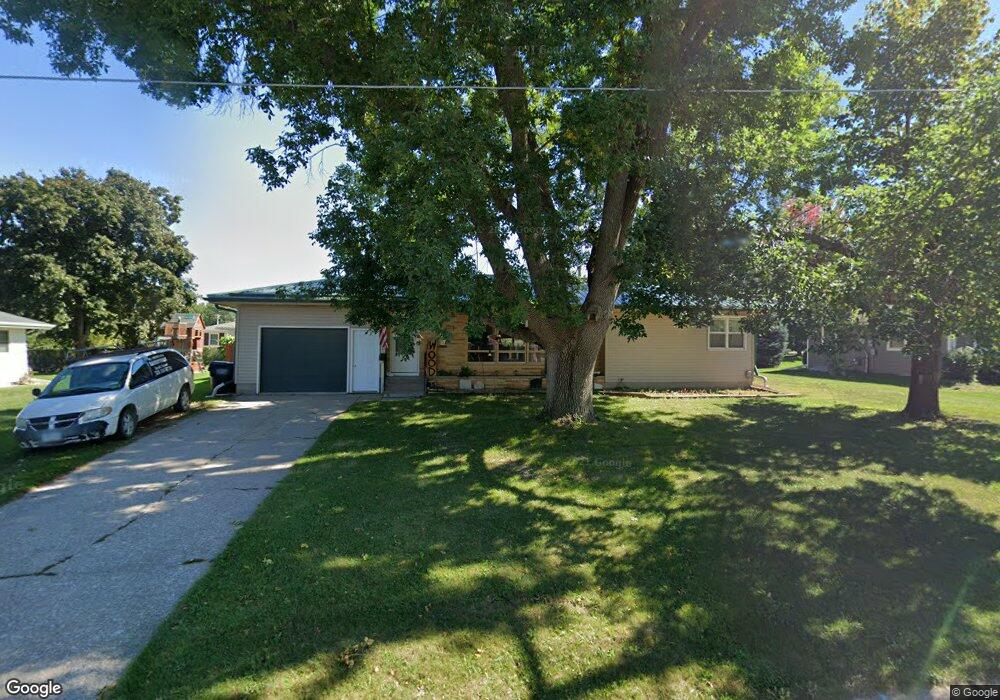
135 Scenic Dr Vinton, IA 52349
Estimated Value: $166,000 - $200,000
2
Beds
2
Baths
1,068
Sq Ft
$174/Sq Ft
Est. Value
About This Home
This home is located at 135 Scenic Dr, Vinton, IA 52349 and is currently estimated at $185,911, approximately $174 per square foot. 135 Scenic Dr is a home located in Benton County with nearby schools including Tilford Elementary School, Shellsburg Elementary School, and Vinton-Shellsburg Middle School.
Ownership History
Date
Name
Owned For
Owner Type
Purchase Details
Closed on
Apr 8, 2011
Sold by
Severson Associates Incorp
Bought by
Dvor Alan R
Current Estimated Value
Purchase Details
Closed on
Feb 3, 2009
Sold by
Ferguson Marilyn D
Bought by
Zea Steven M and Zea Gail A D
Home Financials for this Owner
Home Financials are based on the most recent Mortgage that was taken out on this home.
Original Mortgage
$97,126
Interest Rate
5.08%
Mortgage Type
FHA
Create a Home Valuation Report for This Property
The Home Valuation Report is an in-depth analysis detailing your home's value as well as a comparison with similar homes in the area
Home Values in the Area
Average Home Value in this Area
Purchase History
| Date | Buyer | Sale Price | Title Company |
|---|---|---|---|
| Dvor Alan R | $3,000 | -- | |
| Zea Steven M | -- | None Available |
Source: Public Records
Mortgage History
| Date | Status | Borrower | Loan Amount |
|---|---|---|---|
| Previous Owner | Zea Steven M | $97,126 |
Source: Public Records
Tax History Compared to Growth
Tax History
| Year | Tax Paid | Tax Assessment Tax Assessment Total Assessment is a certain percentage of the fair market value that is determined by local assessors to be the total taxable value of land and additions on the property. | Land | Improvement |
|---|---|---|---|---|
| 2025 | $2,504 | $159,300 | $25,800 | $133,500 |
| 2024 | $2,504 | $143,900 | $25,300 | $118,600 |
| 2023 | $2,320 | $143,900 | $25,300 | $118,600 |
| 2022 | $2,380 | $116,700 | $20,300 | $96,400 |
| 2021 | $2,380 | $116,700 | $20,300 | $96,400 |
| 2020 | $1,934 | $98,200 | $16,600 | $81,600 |
| 2019 | $1,970 | $98,200 | $16,600 | $81,600 |
| 2018 | $1,910 | $98,400 | $15,700 | $82,700 |
| 2017 | $1,832 | $98,400 | $15,700 | $82,700 |
| 2016 | $1,798 | $92,000 | $14,700 | $77,300 |
| 2015 | $1,798 | $92,000 | $14,700 | $77,300 |
| 2014 | $1,976 | $100,100 | $0 | $0 |
Source: Public Records
Map
Nearby Homes