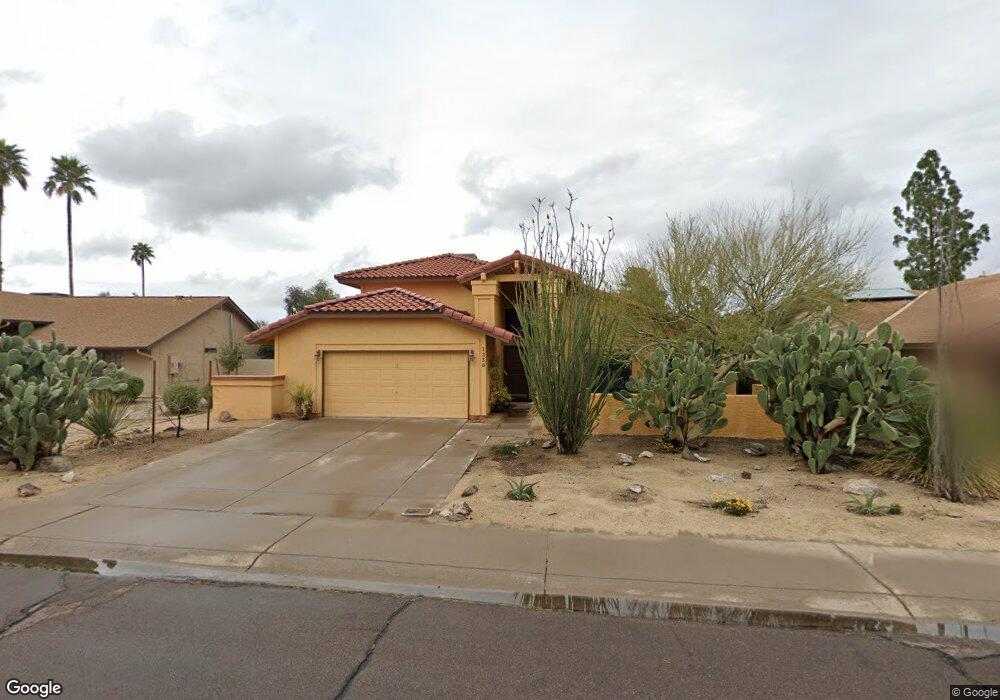
1350 E Mcnair Dr Tempe, AZ 85283
South Tempe NeighborhoodEstimated Value: $436,000 - $661,000
Studio
3
Baths
2,233
Sq Ft
$250/Sq Ft
Est. Value
About This Home
This home is located at 1350 E Mcnair Dr, Tempe, AZ 85283 and is currently estimated at $558,541, approximately $250 per square foot. 1350 E Mcnair Dr is a home located in Maricopa County with nearby schools including Kyrene de los Niños Elementary School, Kyrene del Norte School, and Kyrene Middle School.
Ownership History
Date
Name
Owned For
Owner Type
Purchase Details
Closed on
Apr 23, 2007
Sold by
Kenny Robert J and Kenny Gail L
Bought by
Kenny Robert J and Kenny Gail L
Current Estimated Value
Purchase Details
Closed on
Apr 8, 1999
Sold by
Lundsberg Charles W and Lundsberg Jan
Bought by
Kenny Robert J and Kenny Gail L
Home Financials for this Owner
Home Financials are based on the most recent Mortgage that was taken out on this home.
Original Mortgage
$105,000
Outstanding Balance
$26,588
Interest Rate
7.04%
Mortgage Type
New Conventional
Estimated Equity
$531,953
Purchase Details
Closed on
Jul 31, 1996
Sold by
Kish Paul S and Kish Connie M
Bought by
Lundsberg Charles W and Lundsberg Jan D
Home Financials for this Owner
Home Financials are based on the most recent Mortgage that was taken out on this home.
Original Mortgage
$107,200
Interest Rate
8.33%
Mortgage Type
New Conventional
Create a Home Valuation Report for This Property
The Home Valuation Report is an in-depth analysis detailing your home's value as well as a comparison with similar homes in the area
Home Values in the Area
Average Home Value in this Area
Purchase History
| Date | Buyer | Sale Price | Title Company |
|---|---|---|---|
| Kenny Robert J | -- | None Available | |
| Kenny Robert J | $157,000 | Grand Canyon Title Agency In | |
| Lundsberg Charles W | $134,000 | North American Title Agency |
Source: Public Records
Mortgage History
| Date | Status | Borrower | Loan Amount |
|---|---|---|---|
| Open | Kenny Robert J | $105,000 | |
| Previous Owner | Lundsberg Charles W | $107,200 |
Source: Public Records
Tax History
| Year | Tax Paid | Tax Assessment Tax Assessment Total Assessment is a certain percentage of the fair market value that is determined by local assessors to be the total taxable value of land and additions on the property. | Land | Improvement |
|---|---|---|---|---|
| 2025 | $2,765 | $29,589 | -- | -- |
| 2024 | $2,607 | $28,180 | -- | -- |
| 2023 | $2,607 | $40,550 | $8,110 | $32,440 |
| 2022 | $2,472 | $30,680 | $6,130 | $24,550 |
| 2021 | $2,568 | $29,550 | $5,910 | $23,640 |
| 2020 | $2,507 | $28,080 | $5,610 | $22,470 |
| 2019 | $2,428 | $26,520 | $5,300 | $21,220 |
| 2018 | $2,346 | $24,660 | $4,930 | $19,730 |
| 2017 | $2,249 | $22,820 | $4,560 | $18,260 |
| 2016 | $2,281 | $22,770 | $4,550 | $18,220 |
| 2015 | $2,107 | $20,320 | $4,060 | $16,260 |
Source: Public Records
Map
Nearby Homes
- 1455 E Brentrup Dr
- 1338 E Sunburst Ln
- 1231 E Sunburst Ln
- 1537 E Dava Dr
- 1222 E Louis Way
- 1072 E Sunburst Ln Unit 1
- 1070 E Sunburst Ln
- 1213 E Divot Dr
- 7243 S Alder Dr
- 7716 S Rita Ln Unit 3
- 1045 E Sunburst Ln
- 1060 E Louis Way Unit 14
- 7630 S Bonarden Ln
- 987 E Divot Dr
- 920 E Mcnair Dr
- 6756 S Oak St
- 929 E Derby Dr
- 934 E Verde Ln
- 1861 E Sunburst Ln
- 938 E Knight Ln
- 1356 E Mcnair Dr
- 1346 E Mcnair Dr
- 1351 E Chilton Dr
- 1347 E Chilton Dr
- 1404 E Mcnair Dr
- 1342 E Mcnair Dr
- 1357 E Chilton Dr
- 1347 E Mcnair Dr
- 1343 E Chilton Dr
- 1355 E Mcnair Dr
- 1341 E Mcnair Dr
- 1405 E Chilton Dr Unit 9
- 1412 E Mcnair Dr
- 1403 E Mcnair Dr
- 1330 E Mcnair Dr
- 1333 E Chilton Dr
- 1413 E Chilton Dr
- 1411 E Mcnair Dr
- 1352 E Chilton Dr
- 1346 E Brentrup Dr
Your Personal Tour Guide
Ask me questions while you tour the home.