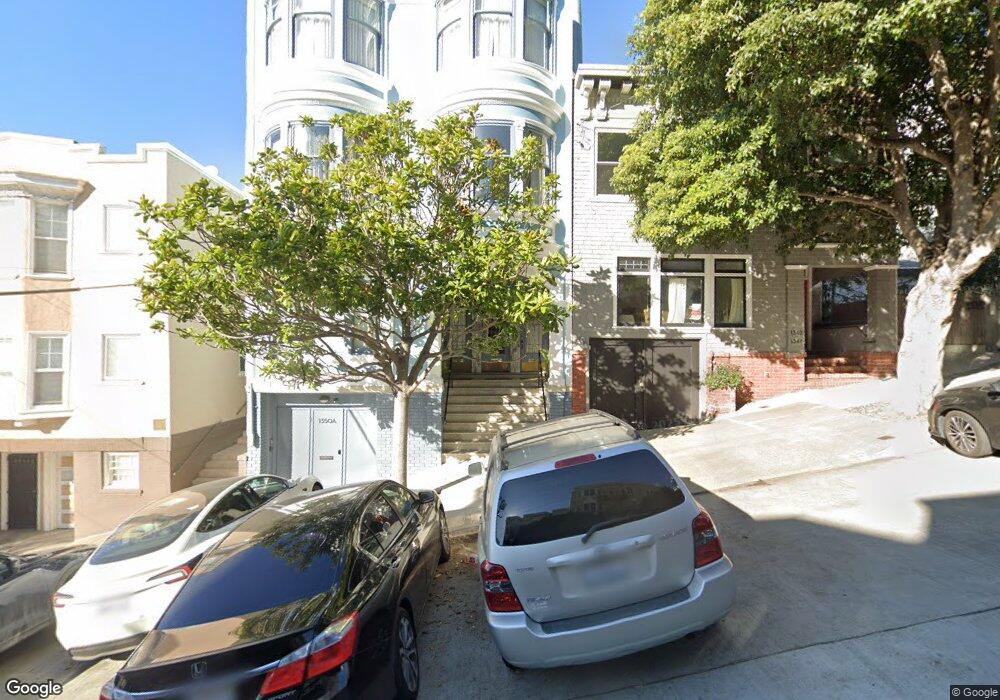
1350 Filbert St San Francisco, CA 94109
Russian Hill NeighborhoodEstimated Value: $1,357,000 - $1,894,000
2
Beds
2
Baths
1,414
Sq Ft
$1,224/Sq Ft
Est. Value
About This Home
This home is located at 1350 Filbert St, San Francisco, CA 94109 and is currently estimated at $1,730,877, approximately $1,224 per square foot. 1350 Filbert St is a home located in San Francisco County with nearby schools including Yick Wo Elementary School, Francisco Middle School, and Saint Brigid Academy.
Ownership History
Date
Name
Owned For
Owner Type
Purchase Details
Closed on
Jul 16, 2021
Sold by
Cracraft Mary and Stensby David G
Bought by
Cracraft Mary and Stensby David G
Current Estimated Value
Home Financials for this Owner
Home Financials are based on the most recent Mortgage that was taken out on this home.
Original Mortgage
$302,000
Outstanding Balance
$274,435
Interest Rate
3%
Mortgage Type
New Conventional
Estimated Equity
$1,456,442
Purchase Details
Closed on
Jul 6, 2012
Sold by
Stensby David G and Cracraft Mary
Bought by
Cracraft Mary
Home Financials for this Owner
Home Financials are based on the most recent Mortgage that was taken out on this home.
Original Mortgage
$315,000
Interest Rate
3.63%
Mortgage Type
New Conventional
Purchase Details
Closed on
Jan 4, 2011
Sold by
Stensby David G and Cracraft Mary
Bought by
Cracraft Mary and Stensby David G
Home Financials for this Owner
Home Financials are based on the most recent Mortgage that was taken out on this home.
Original Mortgage
$335,000
Interest Rate
4.43%
Mortgage Type
New Conventional
Purchase Details
Closed on
Jan 3, 2011
Sold by
Cracraft Mary and Stensby David G
Bought by
Cracraft Mary and Stensby David G
Home Financials for this Owner
Home Financials are based on the most recent Mortgage that was taken out on this home.
Original Mortgage
$335,000
Interest Rate
4.43%
Mortgage Type
New Conventional
Purchase Details
Closed on
Mar 30, 2010
Sold by
Stensby David G and Cracraft Mary M
Bought by
Cracraft Mary and Stensby David G
Home Financials for this Owner
Home Financials are based on the most recent Mortgage that was taken out on this home.
Original Mortgage
$305,000
Interest Rate
4.95%
Mortgage Type
New Conventional
Purchase Details
Closed on
Jan 25, 2005
Sold by
Stensby David G
Bought by
Stensby David G
Purchase Details
Closed on
Apr 2, 2004
Sold by
Cracraft Mary M and Stensby David G
Bought by
Stensby David G and Cracraft Mary M
Home Financials for this Owner
Home Financials are based on the most recent Mortgage that was taken out on this home.
Original Mortgage
$297,000
Interest Rate
5.57%
Mortgage Type
New Conventional
Purchase Details
Closed on
Apr 4, 1996
Sold by
Carroll Daniel A and Obremskey Stasia A
Bought by
Cracraft Mary Miller and Stensby David G
Home Financials for this Owner
Home Financials are based on the most recent Mortgage that was taken out on this home.
Original Mortgage
$358,000
Interest Rate
7.87%
Create a Home Valuation Report for This Property
The Home Valuation Report is an in-depth analysis detailing your home's value as well as a comparison with similar homes in the area
Home Values in the Area
Average Home Value in this Area
Purchase History
| Date | Buyer | Sale Price | Title Company |
|---|---|---|---|
| Cracraft Mary | -- | Amrock Llc | |
| Cracraft Mary | -- | Amrock Llc | |
| Cracraft Mary | -- | Stewart Title Services Of Ca | |
| Stensby David G | -- | Stewart Title Of California | |
| Cracraft Mary | -- | Fidelity National Title Co | |
| Cracraft Mary | -- | Fidelity National Title Co | |
| Cracraft Mary | -- | Fidelity National Title Co | |
| Stensby David G | -- | Fidelity National Title Co | |
| Stensby David G | -- | -- | |
| Cracraft Mary | -- | -- | |
| Stensby David G | -- | First American Title Company | |
| Cracraft Mary Miller | $447,500 | Chicago Title Co |
Source: Public Records
Mortgage History
| Date | Status | Borrower | Loan Amount |
|---|---|---|---|
| Open | Cracraft Mary | $302,000 | |
| Closed | Stensby David G | $315,000 | |
| Closed | Cracraft Mary | $335,000 | |
| Closed | Stensby David G | $305,000 | |
| Closed | Stensby David G | $297,000 | |
| Closed | Cracraft Mary Miller | $358,000 |
Source: Public Records
Tax History Compared to Growth
Tax History
| Year | Tax Paid | Tax Assessment Tax Assessment Total Assessment is a certain percentage of the fair market value that is determined by local assessors to be the total taxable value of land and additions on the property. | Land | Improvement |
|---|---|---|---|---|
| 2025 | $9,882 | $783,923 | $245,007 | $538,916 |
| 2024 | $9,882 | $768,554 | $240,204 | $528,350 |
| 2023 | $9,682 | $753,488 | $235,495 | $517,993 |
| 2022 | $9,189 | $714,561 | $230,879 | $483,682 |
| 2021 | $8,860 | $686,758 | $226,353 | $460,405 |
| 2020 | $8,911 | $679,718 | $224,033 | $455,685 |
| 2019 | $8,611 | $666,392 | $219,641 | $446,751 |
| 2018 | $8,324 | $653,328 | $215,335 | $437,993 |
| 2017 | $7,944 | $640,520 | $211,114 | $429,406 |
| 2016 | $7,866 | $627,964 | $206,976 | $420,988 |
| 2015 | $7,769 | $618,533 | $203,868 | $414,665 |
| 2014 | $7,568 | $606,418 | $199,875 | $406,543 |
Source: Public Records
Map
Nearby Homes
- 2363 Larkin St Unit 34
- 1405 Greenwich St Unit 3
- 1728 Larkin St
- 1380 Greenwich St Unit 205
- 1380 Greenwich St Unit 203
- 2111 Hyde St Unit 505
- 2111 Hyde St Unit 403
- 1438 Green St Unit 3D
- 1275 Lombard St
- 2145 Larkin St
- 2525 Van Ness Ave Unit 502
- 2525 Van Ness Ave Unit 601
- 1501 Filbert St Unit PH7F
- 1268 Lombard St Unit 1
- 16 Delgado Place
- 1100 Union St Unit 1000
- 1100 Union St Unit 1100
- 1568 Union St Unit 301
- 1145 Green St Unit 3
- 1925 Leavenworth St Unit 7
- 1350 Filbert St Unit A
- 1350A Filbert St Unit 1350A
- 1348 Filbert St
- 1346 Filbert St
- 1342 Filbert St
- 1344 Filbert St
- 1364 Filbert St
- 1338 Filbert St Unit A
- 1338 Filbert St Unit C
- 1338 Filbert St
- 1338 Filbert St Unit B
- 1338 Filbert St Unit 4
- 1338 Filbert St Unit 3
- 1338 Filbert St Unit 2
- 1338 Filbert St Unit 1
- 1325 Filbert St
- 1369 Filbert St
- 2405 Larkin St Unit 2405A
- 2415A Larkin St
- 2415 Larkin St