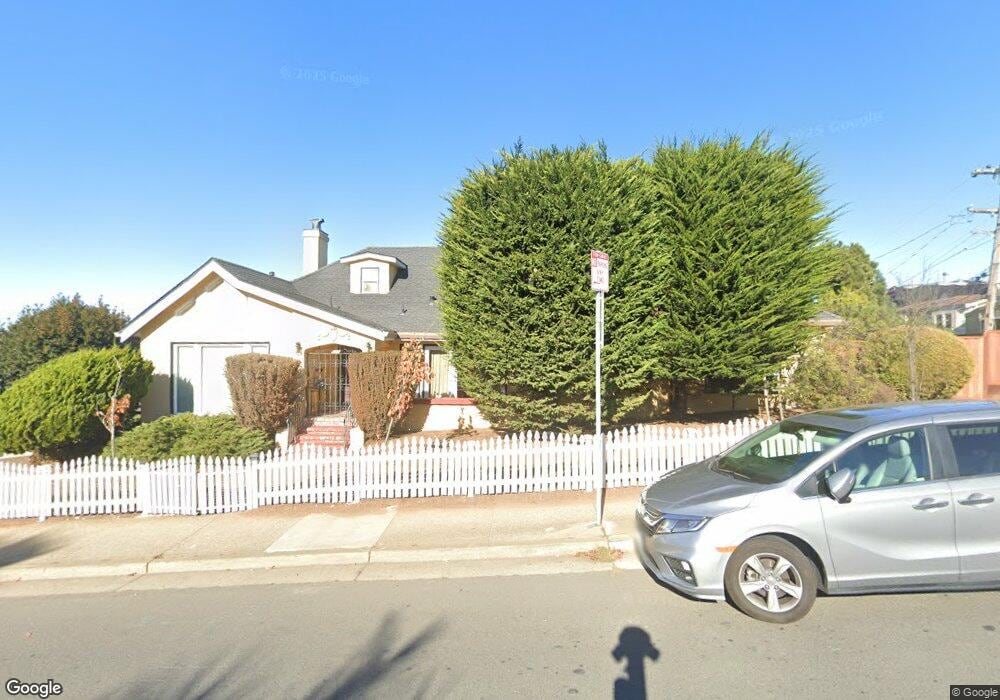
1350 Holloway Ave San Francisco, CA 94132
Ingleside Terrace NeighborhoodEstimated Value: $1,799,000 - $2,267,215
4
Beds
4
Baths
3,153
Sq Ft
$648/Sq Ft
Est. Value
About This Home
This home is located at 1350 Holloway Ave, San Francisco, CA 94132 and is currently estimated at $2,044,054, approximately $648 per square foot. 1350 Holloway Ave is a home located in San Francisco County with nearby schools including Commodore Sloat Elementary School, Aptos Middle School, and St. Stephen School.
Ownership History
Date
Name
Owned For
Owner Type
Purchase Details
Closed on
Feb 3, 2020
Sold by
Vu Andrew and Vu Sophie
Bought by
Vu Andrew and Vu Sophie
Current Estimated Value
Purchase Details
Closed on
Nov 13, 2008
Sold by
Vu Sophie and Vu Andrew
Bought by
Vu Andrew and Vu Sophie
Home Financials for this Owner
Home Financials are based on the most recent Mortgage that was taken out on this home.
Original Mortgage
$1,023,750
Outstanding Balance
$665,001
Interest Rate
5.87%
Mortgage Type
New Conventional
Estimated Equity
$1,379,053
Purchase Details
Closed on
Nov 15, 2007
Sold by
Balestier Corlette and Turner Andre
Bought by
Vu Sophie and Vu Andrew
Home Financials for this Owner
Home Financials are based on the most recent Mortgage that was taken out on this home.
Original Mortgage
$680,000
Interest Rate
6.37%
Mortgage Type
Purchase Money Mortgage
Create a Home Valuation Report for This Property
The Home Valuation Report is an in-depth analysis detailing your home's value as well as a comparison with similar homes in the area
Home Values in the Area
Average Home Value in this Area
Purchase History
| Date | Buyer | Sale Price | Title Company |
|---|---|---|---|
| Vu Andrew | -- | None Available | |
| Vu Andrew | -- | Fidelity National Title Co | |
| Vu Sophie | $850,000 | Fidelity National Title Co |
Source: Public Records
Mortgage History
| Date | Status | Borrower | Loan Amount |
|---|---|---|---|
| Open | Vu Andrew | $1,023,750 | |
| Closed | Vu Sophie | $680,000 |
Source: Public Records
Tax History Compared to Growth
Tax History
| Year | Tax Paid | Tax Assessment Tax Assessment Total Assessment is a certain percentage of the fair market value that is determined by local assessors to be the total taxable value of land and additions on the property. | Land | Improvement |
|---|---|---|---|---|
| 2025 | $17,447 | $1,457,565 | $781,538 | $676,027 |
| 2024 | $17,447 | $1,428,986 | $766,214 | $662,772 |
| 2023 | $17,183 | $1,400,969 | $751,191 | $649,778 |
| 2022 | $16,854 | $1,373,500 | $736,462 | $637,038 |
| 2021 | $16,554 | $1,346,570 | $722,022 | $624,548 |
| 2020 | $16,629 | $1,332,764 | $714,619 | $618,145 |
| 2019 | $16,057 | $1,306,632 | $700,607 | $606,025 |
| 2018 | $15,515 | $1,281,013 | $686,870 | $594,143 |
| 2017 | $15,033 | $1,255,897 | $673,402 | $582,495 |
| 2016 | $14,789 | $1,231,274 | $660,199 | $571,075 |
| 2015 | $14,605 | $1,212,780 | $650,283 | $562,497 |
| 2014 | $14,219 | $1,189,024 | $637,545 | $551,479 |
Source: Public Records
Map
Nearby Homes
- 10 Lunado Way
- 20 Lunado Way
- 1300 Holloway Ave
- 407 Monticello St
- 5 Lunado Way
- 1375 Holloway Ave
- 24 Lunado Way
- 1385 Holloway Ave
- 1355 Holloway Ave
- 415 Monticello St
- 25 Lunado Way
- 399 Monticello St
- 30 Lunado Way
- 901 Junipero Serra Blvd
- 286 Beverly St
- 425 Monticello St
- 385 Monticello St
- 282 Beverly St
- 40 Lunado Way
- 35 Lunado Way