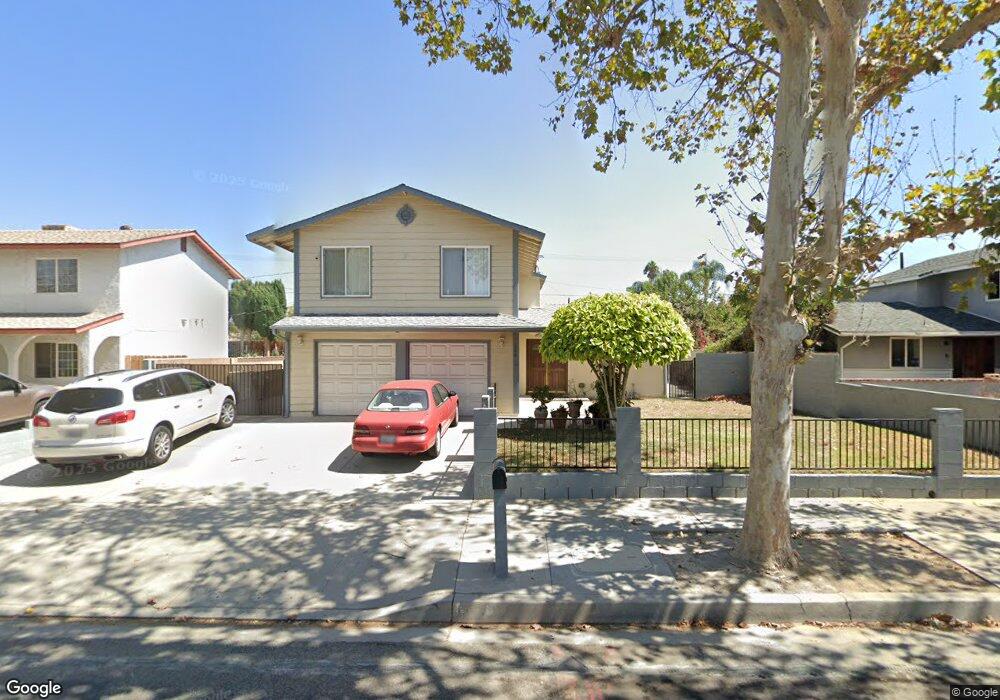
1350 Sycamore Dr Simi Valley, CA 93065
Central Simi Valley NeighborhoodEstimated Value: $757,275 - $850,000
4
Beds
3
Baths
1,818
Sq Ft
$446/Sq Ft
Est. Value
About This Home
This home is located at 1350 Sycamore Dr, Simi Valley, CA 93065 and is currently estimated at $810,069, approximately $445 per square foot. 1350 Sycamore Dr is a home located in Ventura County with nearby schools including Mountain View Elementary School, Hillside Middle School, and Royal High School.
Ownership History
Date
Name
Owned For
Owner Type
Purchase Details
Closed on
Jun 22, 2010
Sold by
Casale Jack D and Casale Maria
Bought by
Casale Jack D and Casale Maria Cristina
Current Estimated Value
Purchase Details
Closed on
Nov 23, 1998
Sold by
Hernandez Ivonne Michele
Bought by
Casale Jack D and Casale Maria
Home Financials for this Owner
Home Financials are based on the most recent Mortgage that was taken out on this home.
Original Mortgage
$155,000
Outstanding Balance
$34,578
Interest Rate
6.84%
Estimated Equity
$775,491
Purchase Details
Closed on
Mar 24, 1997
Sold by
Ambridge Scott D
Bought by
Casale Jack D and Casale Maria
Home Financials for this Owner
Home Financials are based on the most recent Mortgage that was taken out on this home.
Original Mortgage
$155,700
Interest Rate
8.13%
Purchase Details
Closed on
Feb 24, 1995
Sold by
Ambridge Scott and Ambridge Tammara
Bought by
Ambridge Scott and Ambridge Tammara
Create a Home Valuation Report for This Property
The Home Valuation Report is an in-depth analysis detailing your home's value as well as a comparison with similar homes in the area
Home Values in the Area
Average Home Value in this Area
Purchase History
| Date | Buyer | Sale Price | Title Company |
|---|---|---|---|
| Casale Jack D | -- | None Available | |
| Casale Jack D | $52,000 | Fidelity National Title Co | |
| Casale Jack D | $25,000 | American Title Co | |
| Ambridge Scott | -- | -- |
Source: Public Records
Mortgage History
| Date | Status | Borrower | Loan Amount |
|---|---|---|---|
| Open | Casale Jack D | $155,000 | |
| Previous Owner | Casale Jack D | $155,700 | |
| Closed | Ambridge Scott | $0 |
Source: Public Records
Tax History
| Year | Tax Paid | Tax Assessment Tax Assessment Total Assessment is a certain percentage of the fair market value that is determined by local assessors to be the total taxable value of land and additions on the property. | Land | Improvement |
|---|---|---|---|---|
| 2025 | $4,139 | $311,666 | $124,663 | $187,003 |
| 2024 | $4,139 | $305,555 | $122,218 | $183,337 |
| 2023 | $3,816 | $299,564 | $119,821 | $179,743 |
| 2022 | $3,782 | $293,691 | $117,472 | $176,219 |
| 2021 | $3,738 | $287,933 | $115,169 | $172,764 |
| 2020 | $3,650 | $284,983 | $113,989 | $170,994 |
| 2019 | $3,481 | $279,396 | $111,754 | $167,642 |
| 2018 | $3,440 | $273,918 | $109,563 | $164,355 |
| 2017 | $3,355 | $268,548 | $107,415 | $161,133 |
| 2016 | $3,200 | $263,283 | $105,309 | $157,974 |
| 2015 | $3,124 | $259,330 | $103,728 | $155,602 |
| 2014 | $3,070 | $254,253 | $101,698 | $152,555 |
Source: Public Records
Map
Nearby Homes
- 2407 Elizondo Ave
- 2783 Fallon Cir
- 1387 Cherry Ave
- 2490 Invar Ct
- 2267 Morley St
- 2915 Deacon St Unit 17
- 2643 Dusan St
- 1558 Ysrella Ave
- 2820 Rock St
- 1843 Garvin Ave
- 2165 Malcolm St
- 2968 Royal Ave
- 1750 Pope Ave
- 2136 Rosecrans St
- 2405 Lee St
- 2399 Lee St
- 2095 Morley St
- 2025 Royal Ave
- 1091 Vallejo Ave
- 960 Breton St
- 1338 Sycamore Dr
- 1362 Sycamore Dr
- 1332 Sycamore Dr
- 1368 Sycamore Dr
- 2566 Elizondo Ave
- 1319 Rincon St
- 1351 Sycamore Dr
- 1339 Sycamore Dr
- 1320 Sycamore Dr
- 1333 Sycamore Dr
- 1363 Sycamore Dr
- 1307 Rincon St
- 1329 Rincon St
- 1321 Sycamore Dr
- 1369 Sycamore Dr
- 1308 Sycamore Dr
- 1376 Sycamore Dr
- 1348 Sawyer Ave
- 1295 Rincon St
- 1342 Sawyer Ave
Your Personal Tour Guide
Ask me questions while you tour the home.