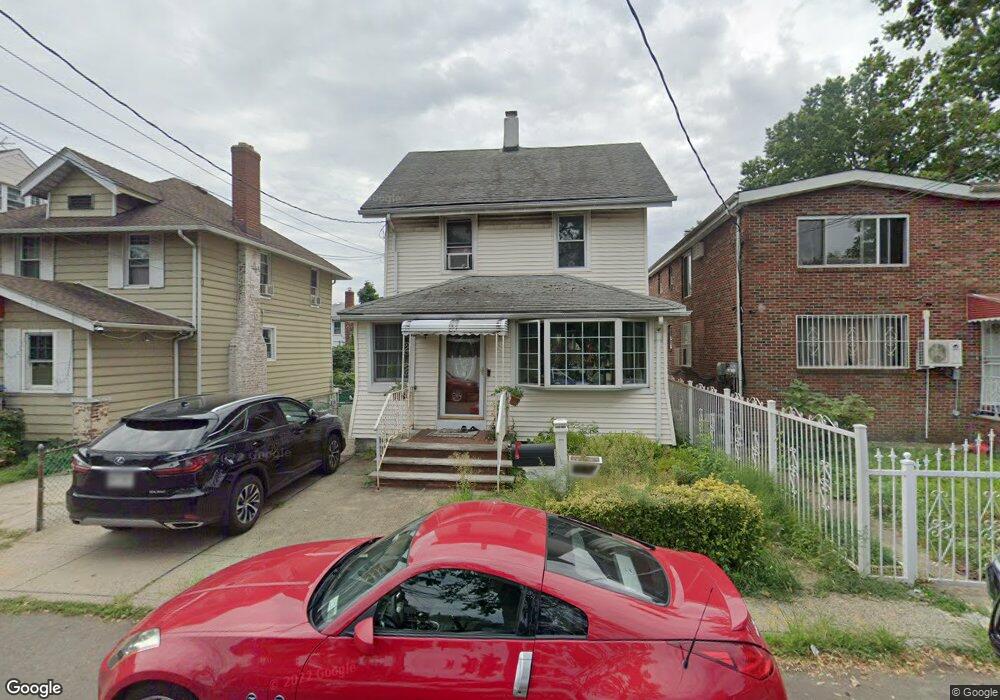
13506 61st Rd Flushing, NY 11367
Queensboro Hill NeighborhoodEstimated Value: $950,000 - $1,045,862
Studio
--
Bath
1,649
Sq Ft
$616/Sq Ft
Est. Value
About This Home
This home is located at 13506 61st Rd, Flushing, NY 11367 and is currently estimated at $1,015,466, approximately $615 per square foot. 13506 61st Rd is a home located in Queens County with nearby schools including P.S. 219 - Paul Klapper, I.S. 250 - The Robert F. Kennedy Community Middle School, and John Bowne High School.
Ownership History
Date
Name
Owned For
Owner Type
Purchase Details
Closed on
Jul 15, 2011
Sold by
Yu Lu Chun
Bought by
Ahmed Faaiqa and Ahmed Shabaz
Current Estimated Value
Home Financials for this Owner
Home Financials are based on the most recent Mortgage that was taken out on this home.
Original Mortgage
$399,200
Outstanding Balance
$273,645
Interest Rate
4.51%
Mortgage Type
Purchase Money Mortgage
Estimated Equity
$741,821
Purchase Details
Closed on
Apr 19, 1996
Sold by
Carmel Arthur and Carmel Steven
Bought by
Yu Lu Chun
Home Financials for this Owner
Home Financials are based on the most recent Mortgage that was taken out on this home.
Original Mortgage
$75,000
Interest Rate
7.77%
Create a Home Valuation Report for This Property
The Home Valuation Report is an in-depth analysis detailing your home's value as well as a comparison with similar homes in the area
Home Values in the Area
Average Home Value in this Area
Purchase History
| Date | Buyer | Sale Price | Title Company |
|---|---|---|---|
| Ahmed Faaiqa | $499,000 | -- | |
| Ahmed Faaiqa | $499,000 | -- | |
| Yu Lu Chun | $129,000 | Commonwealth Land Title Ins | |
| Yu Lu Chun | $129,000 | Commonwealth Land Title Ins |
Source: Public Records
Mortgage History
| Date | Status | Borrower | Loan Amount |
|---|---|---|---|
| Open | Ahmed Faaiqa | $399,200 | |
| Closed | Ahmed Faaiqa | $399,200 | |
| Previous Owner | Yu Lu Chun | $75,000 |
Source: Public Records
Tax History
| Year | Tax Paid | Tax Assessment Tax Assessment Total Assessment is a certain percentage of the fair market value that is determined by local assessors to be the total taxable value of land and additions on the property. | Land | Improvement |
|---|---|---|---|---|
| 2025 | $6,800 | $37,331 | $6,527 | $30,804 |
| 2024 | $6,812 | $35,254 | $6,537 | $28,717 |
| 2023 | $6,454 | $33,534 | $6,626 | $26,908 |
| 2022 | $6,064 | $57,060 | $11,760 | $45,300 |
| 2021 | $6,399 | $57,420 | $11,760 | $45,660 |
| 2020 | $6,289 | $55,500 | $11,760 | $43,740 |
| 2019 | $5,853 | $61,140 | $11,760 | $49,380 |
| 2018 | $5,399 | $27,945 | $7,362 | $20,583 |
| 2017 | $3,853 | $26,512 | $6,384 | $20,128 |
| 2016 | $4,990 | $26,512 | $6,384 | $20,128 |
| 2015 | $2,797 | $25,924 | $10,002 | $15,922 |
| 2014 | $2,797 | $24,482 | $9,413 | $15,069 |
Source: Public Records
Map
Nearby Homes
- 135-15 63rd Ave
- 132-56 60th Ave
- 13214 Horace Harding Expy
- 132-20 60th Ave
- 6307 138th St
- 63-09 138th St
- 6404 136th St
- 13437 58th Rd
- 136-43 58th Rd
- 6114 Main St
- 61-12 Main St
- 13814 58th Rd
- 6431 138th St
- 130-14 60th Ave Unit 2E
- 132-19 58th Ave
- 5804 Main St Unit 2D
- 142-24 61st Rd
- 13710 64th Rd
- 14017 58th Rd
- 13620 Booth Memorial Ave Unit 2A
- 13502 61st Rd
- 13510 61st Rd
- 13502 61st Rd
- 135-02 61st Rd
- 135-10 61st Rd
- 13514 61st Rd
- 13507 62nd Ave Unit 2FL
- 13507 62nd Ave
- 13503 62nd Ave
- 13507 62nd Ave
- 13501 62nd Ave
- 13518 61st Rd
- 135-18 61st Rd Unit 2nd Fl
- 13518 61st Rd
- 135-18 61st Rd
- 13511 62nd Ave
- 135-11 62nd Ave Unit 2
- 135-11 62nd Ave
- 135-11 62nd Ave Unit 1
- 13503 62nd Ave
Your Personal Tour Guide
Ask me questions while you tour the home.