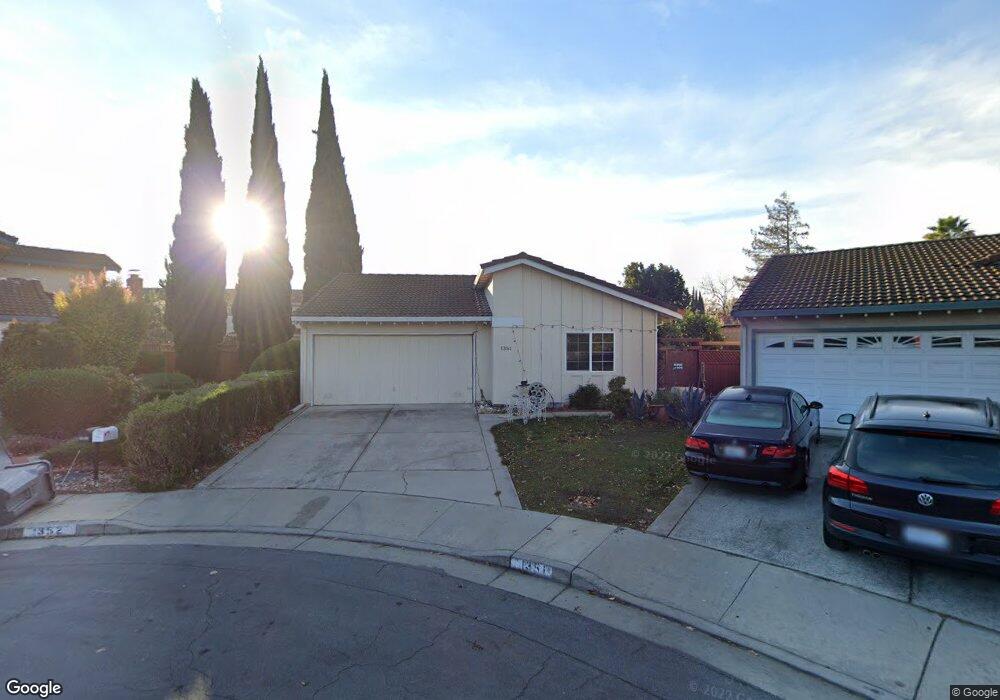
1351 Cutforth Ct San Jose, CA 95132
Ruskin NeighborhoodEstimated Value: $1,307,906 - $1,575,000
3
Beds
2
Baths
1,236
Sq Ft
$1,181/Sq Ft
Est. Value
About This Home
This home is located at 1351 Cutforth Ct, San Jose, CA 95132 and is currently estimated at $1,459,727, approximately $1,181 per square foot. 1351 Cutforth Ct is a home located in Santa Clara County with nearby schools including Ruskin Elementary School, Sierramont Middle School, and Piedmont Hills High School.
Ownership History
Date
Name
Owned For
Owner Type
Purchase Details
Closed on
Mar 22, 2006
Sold by
Andres Leandro L and Andres Narissa U
Bought by
Gonzalez Rosendo and Morales Sandra
Current Estimated Value
Home Financials for this Owner
Home Financials are based on the most recent Mortgage that was taken out on this home.
Original Mortgage
$97,700
Interest Rate
6.25%
Mortgage Type
Stand Alone Second
Purchase Details
Closed on
Nov 6, 2001
Sold by
Chen Chuan Shew and Chen Ling
Bought by
Andres Leandro L and Andres Narissa U
Home Financials for this Owner
Home Financials are based on the most recent Mortgage that was taken out on this home.
Original Mortgage
$332,800
Interest Rate
6.73%
Purchase Details
Closed on
Dec 15, 1997
Sold by
Busing Darren R and Capps Susan
Bought by
Chen Chuan Shew and Chen An Ling
Home Financials for this Owner
Home Financials are based on the most recent Mortgage that was taken out on this home.
Original Mortgage
$160,000
Interest Rate
4.95%
Create a Home Valuation Report for This Property
The Home Valuation Report is an in-depth analysis detailing your home's value as well as a comparison with similar homes in the area
Home Values in the Area
Average Home Value in this Area
Purchase History
| Date | Buyer | Sale Price | Title Company |
|---|---|---|---|
| Gonzalez Rosendo | $651,500 | Alliance Title Company | |
| Andres Leandro L | $416,000 | Financial Title Company | |
| Chen Chuan Shew | $281,000 | Fidelity National Title Co |
Source: Public Records
Mortgage History
| Date | Status | Borrower | Loan Amount |
|---|---|---|---|
| Closed | Gonzalez Rosendo | $97,700 | |
| Open | Gonzalez Rosendo | $520,800 | |
| Previous Owner | Andres Leandro L | $332,800 | |
| Previous Owner | Chen Chuan Shew | $160,000 |
Source: Public Records
Tax History Compared to Growth
Tax History
| Year | Tax Paid | Tax Assessment Tax Assessment Total Assessment is a certain percentage of the fair market value that is determined by local assessors to be the total taxable value of land and additions on the property. | Land | Improvement |
|---|---|---|---|---|
| 2025 | $12,439 | $889,627 | $622,743 | $266,884 |
| 2024 | $12,439 | $872,184 | $610,533 | $261,651 |
| 2023 | $12,224 | $855,083 | $598,562 | $256,521 |
| 2022 | $12,177 | $838,318 | $586,826 | $251,492 |
| 2021 | $11,792 | $821,881 | $575,320 | $246,561 |
| 2020 | $11,436 | $813,454 | $569,421 | $244,033 |
| 2019 | $11,002 | $797,505 | $558,256 | $239,249 |
| 2018 | $10,849 | $781,868 | $547,310 | $234,558 |
| 2017 | $10,919 | $766,538 | $536,579 | $229,959 |
| 2016 | $10,467 | $751,508 | $526,058 | $225,450 |
| 2015 | $9,715 | $690,000 | $483,000 | $207,000 |
| 2014 | $8,074 | $604,000 | $422,800 | $181,200 |
Source: Public Records
Map
Nearby Homes
- 1373 Ferrel Ct
- 2966 Crater Ln
- 2520 Amaryl Dr
- 3190 Vesuvius Ln
- 3092 Halgrim Ct
- 1756 Valhalla Ct
- 2280 Zoria Cir
- 2204 Ladymuir Ct
- 3513 Ivalynn Cir
- 3093 Melchester Dr
- 1810 Blackmore Ct
- 1055 N Capitol Ave Unit 51
- 1055 N Capitol Ave Unit 124
- 1055 N Capitol Ave Unit 180
- 1103 Somerset Dr
- 3308 Whitman Way
- Residence 3 Plan at Ascend
- Residence 1 Plan at Ascend
- Residence 2 Plan at Ascend
- 1545 Stone Creek Dr
- 1357 Cutforth Ct
- 1352 Cutforth Ct
- 2799 Ione Dr
- 2787 Ione Dr
- 1363 Cutforth Ct
- 2811 Ione Dr
- 1358 Morrill Ave
- 1358 Cutforth Ct
- 1369 Cutforth Ct
- 2823 Ione Dr
- 1364 Cutforth Ct
- 1356 Morrill Ave
- 1360 Morrill Ave
- 2763 Ione Dr
- 2934 Crater Ln
- 1375 Cutforth Ct
- 2835 Ione Dr
- 2938 Crater Ln
- 1362 Morrill Ave
- 2942 Crater Ln