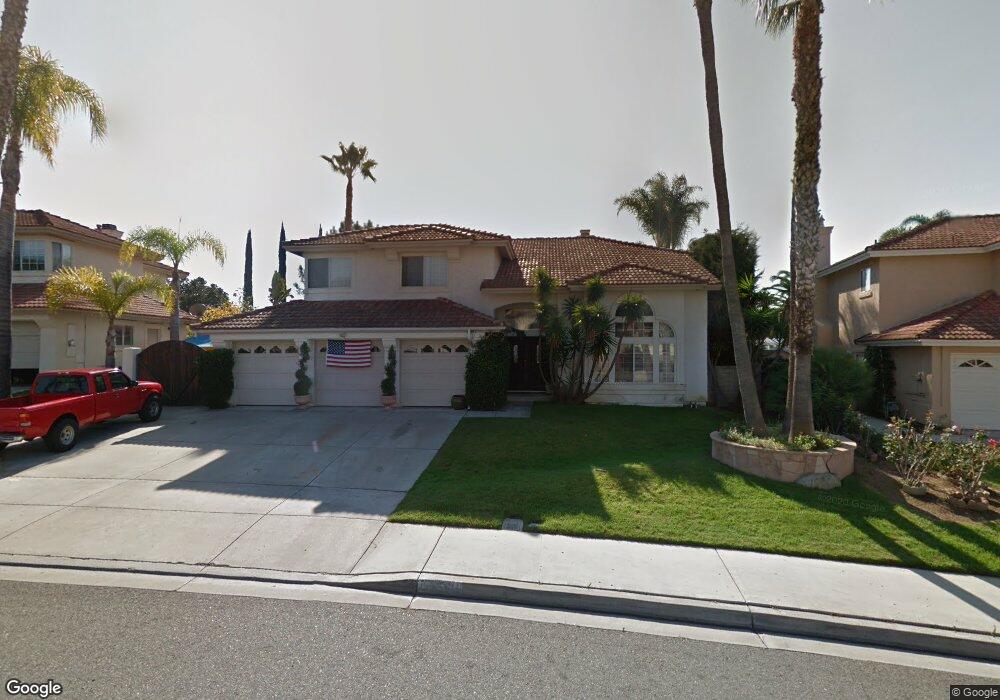
1351 Via Cibola Oceanside, CA 92057
North Valley NeighborhoodEstimated Value: $1,075,000 - $1,120,552
4
Beds
3
Baths
2,627
Sq Ft
$420/Sq Ft
Est. Value
About This Home
This home is located at 1351 Via Cibola, Oceanside, CA 92057 and is currently estimated at $1,104,638, approximately $420 per square foot. 1351 Via Cibola is a home located in San Diego County with nearby schools including Reynolds Elementary School, Martin Luther King Jr. Middle School, and Scholarship Prep Oceanside.
Ownership History
Date
Name
Owned For
Owner Type
Purchase Details
Closed on
Feb 13, 2013
Sold by
Johnsen Ric W and Johnsen Frances I
Bought by
Johnsen Richard William and Johnsen Frances Irene
Current Estimated Value
Purchase Details
Closed on
Dec 6, 2012
Sold by
Johnsen Richard Ric William and Johnsen Frances Irene
Bought by
Johnsen Rick W and Johnsen Frances I
Home Financials for this Owner
Home Financials are based on the most recent Mortgage that was taken out on this home.
Original Mortgage
$269,000
Outstanding Balance
$186,197
Interest Rate
3.35%
Mortgage Type
New Conventional
Estimated Equity
$918,441
Purchase Details
Closed on
Jan 27, 2003
Sold by
Johnsen Richard William and Johnsen Frances Irene
Bought by
Johnsen Richard William and Johnsen Frances Irene
Purchase Details
Closed on
Oct 19, 1992
Create a Home Valuation Report for This Property
The Home Valuation Report is an in-depth analysis detailing your home's value as well as a comparison with similar homes in the area
Home Values in the Area
Average Home Value in this Area
Purchase History
| Date | Buyer | Sale Price | Title Company |
|---|---|---|---|
| Johnsen Richard William | -- | None Available | |
| Johnsen Rick W | -- | Lsi Title Company | |
| Johnsen Richard William | -- | -- | |
| Johnsen Richard William | -- | -- | |
| -- | $209,900 | -- |
Source: Public Records
Mortgage History
| Date | Status | Borrower | Loan Amount |
|---|---|---|---|
| Open | Johnsen Rick W | $269,000 |
Source: Public Records
Tax History Compared to Growth
Tax History
| Year | Tax Paid | Tax Assessment Tax Assessment Total Assessment is a certain percentage of the fair market value that is determined by local assessors to be the total taxable value of land and additions on the property. | Land | Improvement |
|---|---|---|---|---|
| 2025 | $5,396 | $484,067 | $102,265 | $381,802 |
| 2024 | $5,396 | $474,576 | $100,260 | $374,316 |
| 2023 | $5,229 | $465,272 | $98,295 | $366,977 |
| 2022 | $5,148 | $456,150 | $96,368 | $359,782 |
| 2021 | $5,164 | $447,207 | $94,479 | $352,728 |
| 2020 | $5,006 | $442,623 | $93,511 | $349,112 |
| 2019 | $4,861 | $433,945 | $91,678 | $342,267 |
| 2018 | $4,807 | $425,437 | $89,881 | $335,556 |
| 2017 | $4,717 | $417,096 | $88,119 | $328,977 |
| 2016 | $4,564 | $408,919 | $86,392 | $322,527 |
| 2015 | $4,431 | $402,778 | $85,095 | $317,683 |
| 2014 | $4,261 | $394,890 | $83,429 | $311,461 |
Source: Public Records
Map
Nearby Homes
- 871 Niguel St
- 671 Parker St
- 675 Parker St
- 5116 Weymouth Way
- 0 Indian View Dr
- 5108 Eliot St
- 1473 Salem Ct
- 1477 Salem Ct
- 1479 Puritan Dr
- 1447 Puritan Dr
- 4795 Stephanie Place
- 5014 El Mirlo Dr
- 1061 Boulder Place
- 530 Roja Dr
- 1049 Boulder Place
- 796 Arthur Ave
- 1120 Parkview Dr
- 361 Point Windemere Place
- 1247 Bellingham Dr
- 1105 Breakaway Dr
- 1355 Via Cibola
- 1347 Via Cibola
- 1343 Via Cibola
- 5103 Via Castilla
- 1339 Via Cibola
- 5102 Via Madrid
- 5107 Via Castilla
- 5102 Via Castilla
- 1363 Via Cibola
- 5106 Via Madrid
- 1335 Via Cibola
- 1367 Via Cibola
- 5111 Via Castilla
- 5106 Via Castilla
- 5110 Via Madrid
- 5107 Via Malaguena
- 1331 Via Cibola
- 1371 Via Cibola
- 5110 Via Castilla
- 5115 Via Castilla