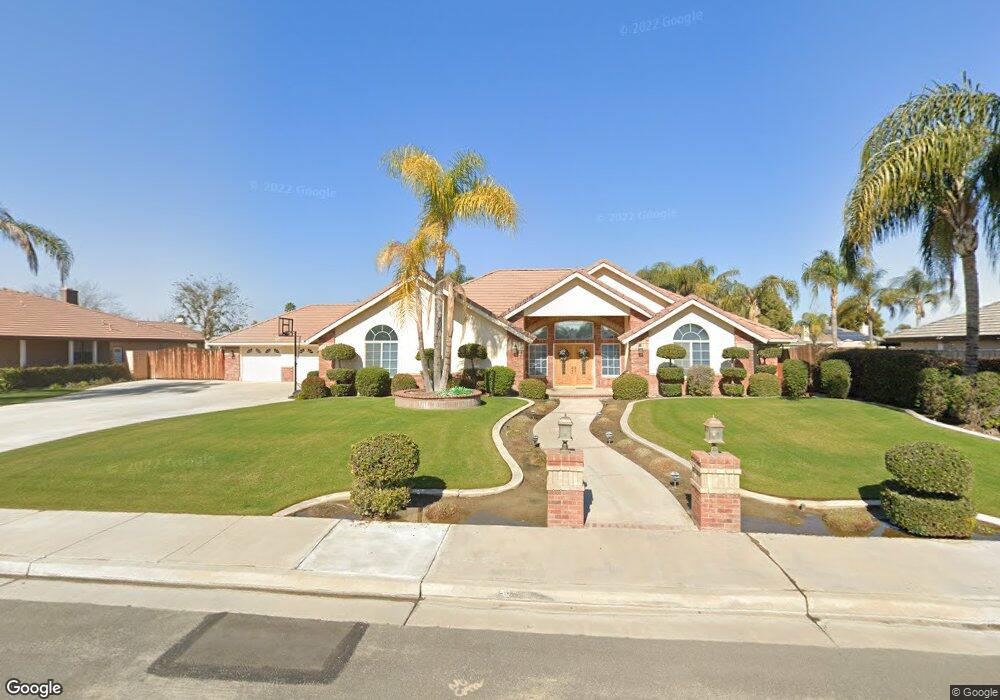
13520 Table Rock Ave Bakersfield, CA 93314
Estimated Value: $761,000 - $801,243
4
Beds
3
Baths
3,332
Sq Ft
$235/Sq Ft
Est. Value
About This Home
This home is located at 13520 Table Rock Ave, Bakersfield, CA 93314 and is currently estimated at $781,811, approximately $234 per square foot. 13520 Table Rock Ave is a home located in Kern County with nearby schools including Patriot Elementary School, Freedom Middle School, and Frontier High School.
Ownership History
Date
Name
Owned For
Owner Type
Purchase Details
Closed on
Oct 20, 2015
Sold by
Hughes Tracy M
Bought by
The David Christopher Hughes & Tracy Mar
Current Estimated Value
Purchase Details
Closed on
Jan 10, 2014
Sold by
Moore John C and Hughes Tracy M
Bought by
Hughes Tracy M
Purchase Details
Closed on
Mar 29, 2011
Sold by
Hughes David C
Bought by
Hughes Tracy M
Home Financials for this Owner
Home Financials are based on the most recent Mortgage that was taken out on this home.
Original Mortgage
$324,000
Outstanding Balance
$223,217
Interest Rate
4.77%
Mortgage Type
New Conventional
Estimated Equity
$558,594
Purchase Details
Closed on
Mar 25, 2011
Sold by
Moore Marcia
Bought by
Moore John C
Home Financials for this Owner
Home Financials are based on the most recent Mortgage that was taken out on this home.
Original Mortgage
$324,000
Outstanding Balance
$223,217
Interest Rate
4.77%
Mortgage Type
New Conventional
Estimated Equity
$558,594
Create a Home Valuation Report for This Property
The Home Valuation Report is an in-depth analysis detailing your home's value as well as a comparison with similar homes in the area
Home Values in the Area
Average Home Value in this Area
Purchase History
| Date | Buyer | Sale Price | Title Company |
|---|---|---|---|
| The David Christopher Hughes & Tracy Mar | -- | None Available | |
| Hughes Tracy M | -- | Lsi | |
| Hughes Tracy M | -- | Stewart Title Of California | |
| Moore John C | $415,000 | Stewart Title Of California | |
| Moore John C | -- | Stewart Title Of California |
Source: Public Records
Mortgage History
| Date | Status | Borrower | Loan Amount |
|---|---|---|---|
| Open | Moore John C | $324,000 |
Source: Public Records
Tax History Compared to Growth
Tax History
| Year | Tax Paid | Tax Assessment Tax Assessment Total Assessment is a certain percentage of the fair market value that is determined by local assessors to be the total taxable value of land and additions on the property. | Land | Improvement |
|---|---|---|---|---|
| 2025 | $7,427 | $571,102 | $127,628 | $443,474 |
| 2024 | $7,427 | $559,905 | $125,126 | $434,779 |
| 2023 | $7,211 | $548,927 | $122,673 | $426,254 |
| 2022 | $7,073 | $538,165 | $120,268 | $417,897 |
| 2021 | $6,927 | $527,613 | $117,910 | $409,703 |
| 2020 | $6,836 | $522,203 | $116,701 | $405,502 |
| 2019 | $6,730 | $522,203 | $116,701 | $405,502 |
| 2018 | $6,561 | $501,926 | $112,170 | $389,756 |
| 2017 | $6,467 | $492,085 | $109,971 | $382,114 |
| 2016 | $6,019 | $482,437 | $107,815 | $374,622 |
| 2015 | $5,957 | $475,191 | $106,196 | $368,995 |
| 2014 | $5,485 | $433,725 | $83,609 | $350,116 |
Source: Public Records
Map
Nearby Homes
- 0 Rosedale Unit 202511650
- 14012 Cedar Creek Ave
- 3849 Jenkins Rd
- 13946 Santa fe Ct
- 13602 Philip Phelps Ave
- 14014 Santa fe Ct
- 13601 Philip Phelps Ave
- 13507 Velma Pearl Way
- 3611 Jenkins Rd
- 13615 Velma Pearl Way
- 13303 Ascot Ct
- 3616 Three Bars St
- 13421 Cheyenne Mountain Dr
- 13404 Cheyenne Mountain Dr
- 14508 Plumeria Ct
- 13118 Ridgeway Meadows Dr
- 12603 Grand Teton Dr
- 14631 Blue Stream Ave
- 4900 Rushmore Dr
- 5308 Elk Run Ct
- 13540 Table Rock Ave
- 13500 Table Rock Ave
- 13541 Cedar Creek Ave
- 13501 Cedar Creek Ave
- 13521 Table Rock Ave
- 13501 Table Rock Ave
- 13440 Table Rock Ave
- 13601 Cedar Creek Ave
- 13541 Table Rock Ave
- 13441 Table Rock Ave
- 13441 Cedar Creek Ave
- 13601 Table Rock Ave
- 13421 Table Rock Ave
- 13620 Table Rock Ave
- 13621 Cedar Creek Ave
- 13520 Cedar Creek Ave
- 13540 Cedar Creek Ave
- 13500 Cedar Creek Ave
- 13621 Table Rock Ave
- 13440 Cedar Creek Ave