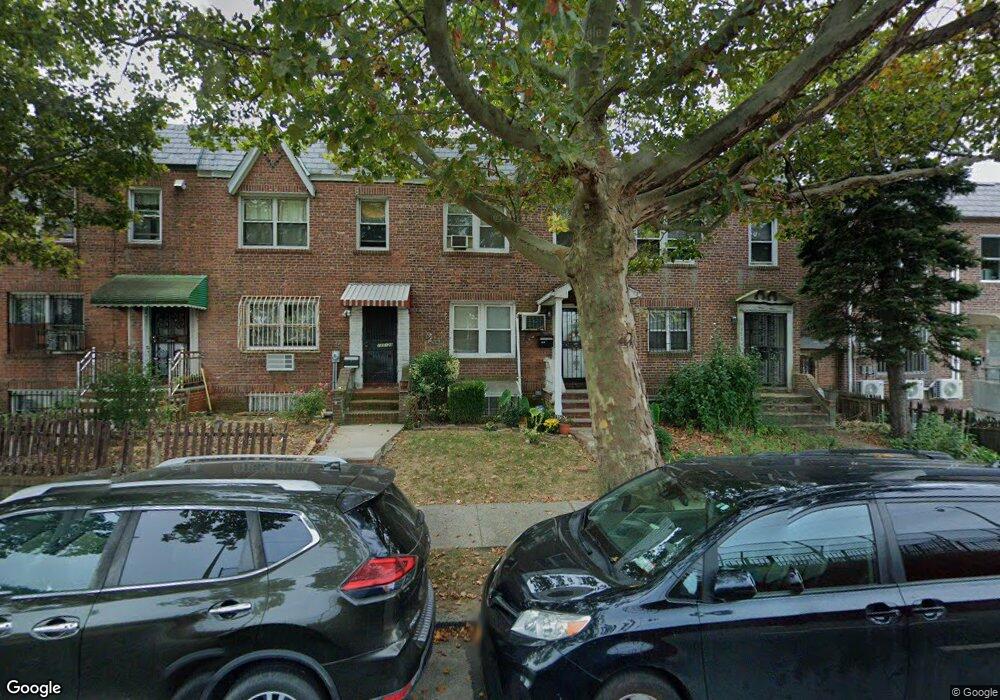
13526 Horace Harding Expy Flushing, NY 11367
Flushing NeighborhoodEstimated Value: $847,858 - $932,000
--
Bed
--
Bath
1,224
Sq Ft
$732/Sq Ft
Est. Value
About This Home
This home is located at 13526 Horace Harding Expy, Flushing, NY 11367 and is currently estimated at $895,465, approximately $731 per square foot. 13526 Horace Harding Expy is a home located in Queens County with nearby schools including I.S. 250 - The Robert F. Kennedy Community Middle School, John Bowne High School, and The Lowell School.
Ownership History
Date
Name
Owned For
Owner Type
Purchase Details
Closed on
May 19, 2025
Sold by
Lamotte Lorna J and Lamotte Richard
Bought by
Lamotte Trust Dated May 19 2025 and Lamotte Trustee Lorna Jewell
Current Estimated Value
Purchase Details
Closed on
Oct 20, 1998
Sold by
Mangialomini Kathleen Safarik and Spatz Anna Helen
Bought by
Lamotte Richard and Lamotte Lorna J
Home Financials for this Owner
Home Financials are based on the most recent Mortgage that was taken out on this home.
Original Mortgage
$145,350
Interest Rate
6.8%
Mortgage Type
Purchase Money Mortgage
Create a Home Valuation Report for This Property
The Home Valuation Report is an in-depth analysis detailing your home's value as well as a comparison with similar homes in the area
Home Values in the Area
Average Home Value in this Area
Purchase History
| Date | Buyer | Sale Price | Title Company |
|---|---|---|---|
| Lamotte Trust Dated May 19 2025 | -- | -- | |
| Lamotte Trust Dated May 19 2025 | -- | -- | |
| Lamotte Richard | $153,000 | The Title Guarantee Company | |
| Lamotte Richard | $153,000 | The Title Guarantee Company |
Source: Public Records
Mortgage History
| Date | Status | Borrower | Loan Amount |
|---|---|---|---|
| Previous Owner | Lamotte Richard | $145,350 |
Source: Public Records
Tax History Compared to Growth
Tax History
| Year | Tax Paid | Tax Assessment Tax Assessment Total Assessment is a certain percentage of the fair market value that is determined by local assessors to be the total taxable value of land and additions on the property. | Land | Improvement |
|---|---|---|---|---|
| 2025 | $6,995 | $38,399 | $7,134 | $31,265 |
| 2024 | $7,007 | $36,228 | $6,324 | $29,904 |
| 2023 | $6,915 | $35,831 | $6,529 | $29,302 |
| 2022 | $6,866 | $50,340 | $9,720 | $40,620 |
| 2021 | $6,842 | $47,400 | $9,720 | $37,680 |
| 2020 | $6,477 | $46,800 | $9,720 | $37,080 |
| 2019 | $6,023 | $46,080 | $9,720 | $36,360 |
| 2018 | $5,789 | $29,859 | $7,274 | $22,585 |
| 2017 | $5,787 | $29,859 | $7,690 | $22,169 |
| 2016 | $5,340 | $29,859 | $7,690 | $22,169 |
| 2015 | $3,178 | $26,666 | $7,511 | $19,155 |
| 2014 | $3,178 | $25,159 | $7,848 | $17,311 |
Source: Public Records
Map
Nearby Homes
- 61-31 136th St
- 136-28 62nd Ave
- 13506 62nd Rd
- 132-56 60th Ave
- 63-05 138th St
- 63-09 138th St
- 13214 Horace Harding Expy
- 13403 59th Ave
- 6339 136th St
- 132-20 60th Ave
- 132-25 60th Ave
- 61-12 Main St
- 136-43 58th Rd
- 58-15 134th St
- 138-65 63rd Ave
- 6431 138th St
- 58-04 Main St Unit 1A
- 5804 Main St Unit 2D
- 64-35 138th St
- 5739 134th St
- 13524 Horace Harding Expy
- 135-28 Horace Harding Expy
- 13532 Horace Harding Expy
- 13530 Horace Harding Expy
- 13528 Horace Harding Expy
- 13522 Horace Harding Expy
- 135-22 Horace Harding Expy
- 13520 Horace Harding Expy
- 135-18 Horace Harding Expy
- 13518 Horace Harding Expy
- 13516 Horace Harding Expy
- 6122 136th St
- 13514 Horace Harding Expy
- 6124 136th St
- 135-12 Horace Harding Expy Unit 2Fl
- 13512 Horace Harding Expy
- 13522 61st Rd
- 135-18 61st Rd Unit 2nd Fl
- 13518 61st Rd
- 135-18 61st Rd