Estimated Value: $817,000 - $903,000
3
Beds
2
Baths
1,218
Sq Ft
$719/Sq Ft
Est. Value
About This Home
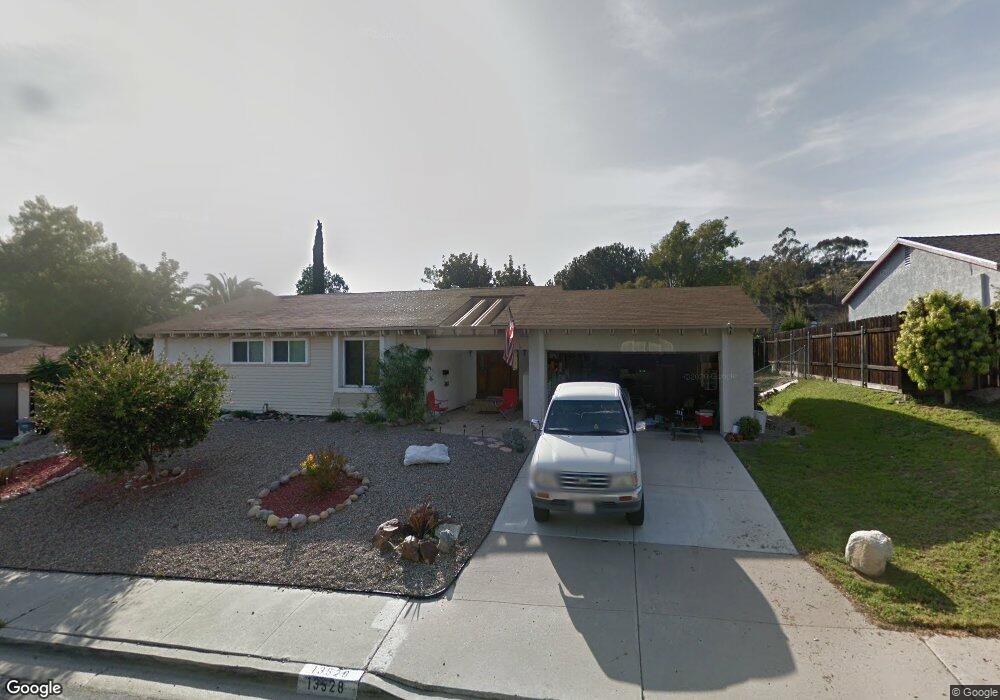
This home is located at 13528 Carriage Rd, Poway, CA 92064 and is currently estimated at $875,951, approximately $719 per square foot. 13528 Carriage Rd is a home located in San Diego County with nearby schools including Valley Elementary School, Meadowbrook Middle, and Poway High.
Ownership History
Date
Name
Owned For
Owner Type
Purchase Details
Closed on
Sep 12, 2013
Sold by
French William and French Ashley
Bought by
Desai Chetan D
Current Estimated Value
Home Financials for this Owner
Home Financials are based on the most recent Mortgage that was taken out on this home.
Original Mortgage
$332,000
Outstanding Balance
$248,336
Interest Rate
4.46%
Mortgage Type
New Conventional
Estimated Equity
$627,615
Purchase Details
Closed on
Apr 28, 2011
Sold by
Murphy Rosemarie Elizabeth
Bought by
French William and French Ashley
Home Financials for this Owner
Home Financials are based on the most recent Mortgage that was taken out on this home.
Original Mortgage
$326,880
Interest Rate
4.71%
Mortgage Type
VA
Purchase Details
Closed on
Dec 30, 1996
Sold by
Murphy Bernard R and Murphy Rosemarie E
Bought by
Murphy Bernard Richard and Murphy Rosemarie
Create a Home Valuation Report for This Property
The Home Valuation Report is an in-depth analysis detailing your home's value as well as a comparison with similar homes in the area
Home Values in the Area
Average Home Value in this Area
Purchase History
| Date | Buyer | Sale Price | Title Company |
|---|---|---|---|
| Desai Chetan D | $415,000 | Fidelity National Title | |
| French William | $320,000 | Advantage Title Inc | |
| Murphy Bernard Richard | -- | -- |
Source: Public Records
Mortgage History
| Date | Status | Borrower | Loan Amount |
|---|---|---|---|
| Open | Desai Chetan D | $332,000 | |
| Previous Owner | French William | $326,880 |
Source: Public Records
Tax History
| Year | Tax Paid | Tax Assessment Tax Assessment Total Assessment is a certain percentage of the fair market value that is determined by local assessors to be the total taxable value of land and additions on the property. | Land | Improvement |
|---|---|---|---|---|
| 2025 | $5,612 | $508,721 | $386,140 | $122,581 |
| 2024 | $5,612 | $498,747 | $378,569 | $120,178 |
| 2023 | $5,492 | $488,969 | $371,147 | $117,822 |
| 2022 | $5,400 | $479,382 | $363,870 | $115,512 |
| 2021 | $5,330 | $469,984 | $356,736 | $113,248 |
| 2020 | $5,258 | $465,166 | $353,079 | $112,087 |
| 2019 | $5,122 | $456,046 | $346,156 | $109,890 |
| 2018 | $4,978 | $447,105 | $339,369 | $107,736 |
| 2017 | $4,845 | $438,339 | $332,715 | $105,624 |
| 2016 | $4,745 | $429,745 | $326,192 | $103,553 |
| 2015 | $4,674 | $423,291 | $321,293 | $101,998 |
| 2014 | $4,564 | $415,000 | $315,000 | $100,000 |
Source: Public Records
Map
Nearby Homes
- 13641 Carriage Rd
- 12739 Papago Dr
- 12939 Cree Ct
- 13442 Mountainside Dr
- 12614 Orohaven Ln
- 12719 Robison Blvd Unit 18
- 12938 Yankton Dr
- 13004 Tuscarora Dr
- 12865 Carriage Heights Way
- 12450 Robison Blvd
- 13056 Poway Rd
- 1/2 Poway Rd
- 13824 Powers Rd
- 13087 Olympus Cir Unit 2
- 13085 Olympus Cir Unit 1
- 13650 Mulberry Tree Ct Unit 167
- 13254 Powers Ct
- 13111 Tobiasson Rd
- 12834 Rockwell Ct
- 12953 Carriage Rd
- 13531 Utopia Rd
- 13538 Carriage Rd
- 13539 Utopia Rd
- 13523 Utopia Rd
- 13550 Carriage Rd
- 13512 Carriage Rd
- 13547 Utopia Rd
- 13529 Carriage Rd
- 13537 Carriage Rd
- 13521 Carriage Rd
- 13515 Utopia Rd
- 13536 Utopia Rd
- 13545 Carriage Rd
- 13540 Utopia Rd
- 13513 Carriage Rd
- 13530 Utopia Rd
- 13502 Carriage Rd
- 13553 Carriage Rd
- 13548 Utopia Rd
- 1 Carriage Rd
Your Personal Tour Guide
Ask me questions while you tour the home.