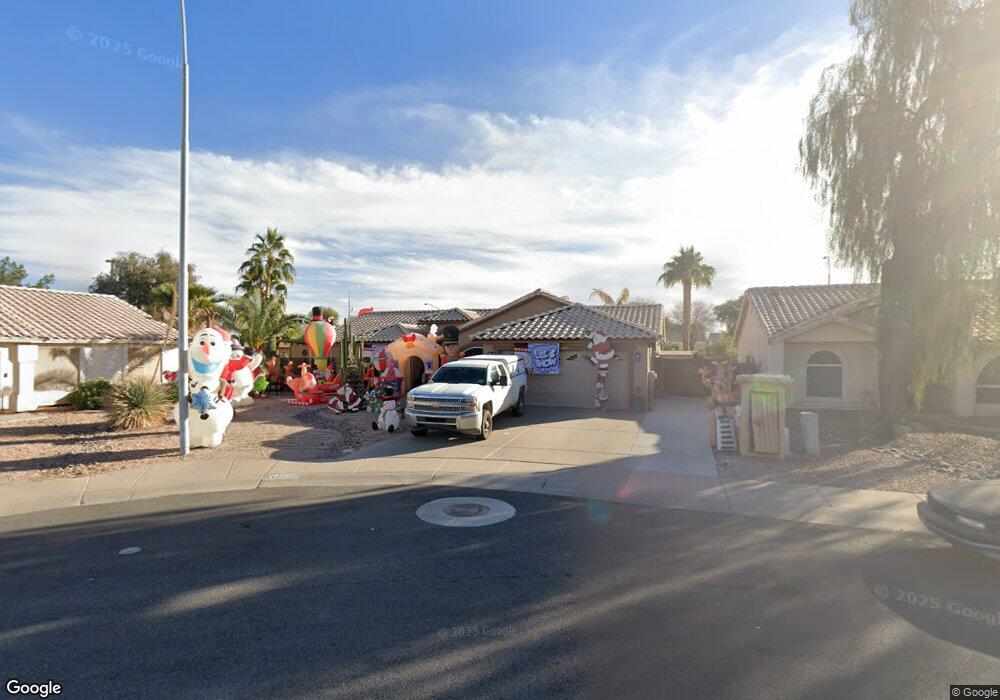
13529 E Cindy St Chandler, AZ 85225
East Chandler NeighborhoodEstimated Value: $467,000 - $645,000
Studio
4
Baths
2,036
Sq Ft
$283/Sq Ft
Est. Value
About This Home
This home is located at 13529 E Cindy St, Chandler, AZ 85225 and is currently estimated at $575,380, approximately $282 per square foot. 13529 E Cindy St is a home located in Maricopa County with nearby schools including Chandler Traditional Academy-Humphrey, Willis Junior High School, and Imagine West Gilbert Elementary School.
Ownership History
Date
Name
Owned For
Owner Type
Purchase Details
Closed on
Jul 30, 2020
Sold by
Messerole Jay L and Messerole Tamara Sue
Bought by
Messerole Jay L and Messerole Tamara S
Current Estimated Value
Purchase Details
Closed on
May 27, 1997
Sold by
Messerole Jay L and Messerole Tamara Sue
Bought by
Messerole Jay L and Messerole Tamara Sue
Home Financials for this Owner
Home Financials are based on the most recent Mortgage that was taken out on this home.
Original Mortgage
$112,500
Outstanding Balance
$16,307
Interest Rate
8.13%
Estimated Equity
$559,073
Purchase Details
Closed on
Jun 15, 1994
Sold by
Tro Lini Builders Inc
Bought by
Wilson Tamara Sue and Messerole Jay L
Home Financials for this Owner
Home Financials are based on the most recent Mortgage that was taken out on this home.
Original Mortgage
$98,108
Interest Rate
8.6%
Mortgage Type
FHA
Create a Home Valuation Report for This Property
The Home Valuation Report is an in-depth analysis detailing your home's value as well as a comparison with similar homes in the area
Home Values in the Area
Average Home Value in this Area
Purchase History
| Date | Buyer | Sale Price | Title Company |
|---|---|---|---|
| Messerole Jay L | -- | None Available | |
| Messerole Jay L | -- | Stewart Title & Trust | |
| Wilson Tamara Sue | $99,000 | Chicago Title Insurance Co |
Source: Public Records
Mortgage History
| Date | Status | Borrower | Loan Amount |
|---|---|---|---|
| Open | Messerole Jay L | $112,500 | |
| Closed | Wilson Tamara Sue | $98,108 |
Source: Public Records
Tax History
| Year | Tax Paid | Tax Assessment Tax Assessment Total Assessment is a certain percentage of the fair market value that is determined by local assessors to be the total taxable value of land and additions on the property. | Land | Improvement |
|---|---|---|---|---|
| 2025 | $2,145 | $24,646 | -- | -- |
| 2024 | $2,028 | $23,472 | -- | -- |
| 2023 | $2,028 | $42,910 | $8,580 | $34,330 |
| 2022 | $1,928 | $31,370 | $6,270 | $25,100 |
| 2021 | $2,024 | $30,730 | $6,140 | $24,590 |
| 2020 | $2,029 | $28,130 | $5,620 | $22,510 |
| 2019 | $1,962 | $25,830 | $5,160 | $20,670 |
| 2018 | $1,903 | $24,570 | $4,910 | $19,660 |
| 2017 | $1,788 | $22,560 | $4,510 | $18,050 |
| 2016 | $1,674 | $22,850 | $4,570 | $18,280 |
| 2015 | $1,646 | $22,570 | $4,510 | $18,060 |
Source: Public Records
Map
Nearby Homes
- 28 E Joseph Way
- 42 E Joseph Way
- 2721 E Folley Place
- 244 E Joseph Way
- 66 E Julian Dr
- 13402 E Boston St
- 15802 S Gilbert Rd Unit 120
- 2573 E Commonwealth Cir
- 15606 S Gilbert Rd Unit 109
- 15606 S Gilbert Rd Unit 63
- 320 E Mary Ln
- 311 E Frances Ln
- 438 E Benrich Dr
- 252 N Wilson Dr
- 2600 E Springfield Place Unit 58
- 2600 E Springfield Place Unit 110
- 2600 E Springfield Place Unit 20
- 417 E Frances Ln
- 2230 E Frye Rd
- 3153 S Sierra St
- 16233 S Spartan St
- 13525 E Cindy St
- 13521 E Cindy St
- 16227 S Spartan St
- 2960 E Folley Place
- 13524 E Cindy St
- 2930 E Folley Place
- 13517 E Cindy St
- 2990 E Folley Place
- 16221 S Spartan St
- 13520 E Cindy St
- 2900 E Folley Place
- 13523 E Chicago St
- 13513 E Cindy St Unit SHARP!
- 13513 E Cindy St
- 13519 E Chicago St
- 2774 S Elm St
- 16215 S Spartan St
- 2870 E Folley Place
- 2762 S Elm St
Your Personal Tour Guide
Ask me questions while you tour the home.