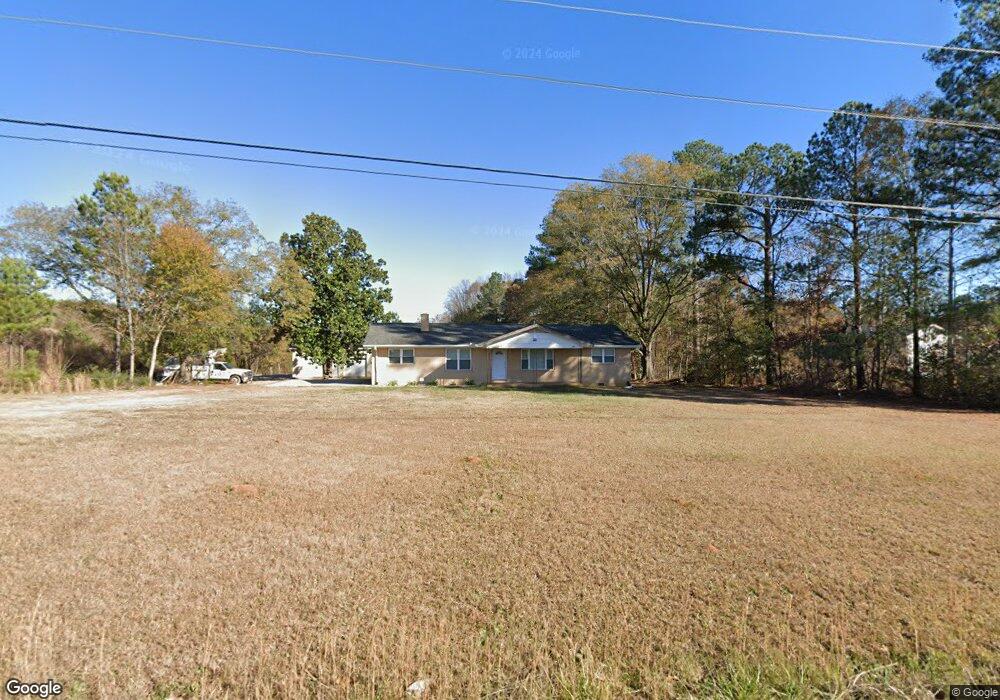
1353 Duncan Reidville Rd Duncan, SC 29334
Estimated Value: $167,000 - $241,000
3
Beds
2
Baths
1,260
Sq Ft
$159/Sq Ft
Est. Value
About This Home
This home is located at 1353 Duncan Reidville Rd, Duncan, SC 29334 and is currently estimated at $200,053, approximately $158 per square foot. 1353 Duncan Reidville Rd is a home located in Spartanburg County with nearby schools including Abner Creek Academy, Byrnes Freshman Academy, and Berry Shoals Intermediate School.
Ownership History
Date
Name
Owned For
Owner Type
Purchase Details
Closed on
Jun 23, 2020
Sold by
Piurkowski Melissa
Bought by
New Start Investments Llc
Current Estimated Value
Purchase Details
Closed on
Jan 13, 2020
Sold by
Daugherty James T and Daugherty Elizabeth A
Bought by
Piurkowski Melissa
Purchase Details
Closed on
Mar 3, 2005
Sold by
Branch Banking & Trust Co Of Sc
Bought by
Daugherty James T and Daugherty Elizabeth A
Home Financials for this Owner
Home Financials are based on the most recent Mortgage that was taken out on this home.
Original Mortgage
$45,000
Interest Rate
5.6%
Mortgage Type
New Conventional
Purchase Details
Closed on
Oct 8, 2004
Sold by
Boggs Boyce E
Bought by
Branch Banking & Trust Co Of Sc
Purchase Details
Closed on
Jul 13, 2000
Sold by
Dillard Oscar W and Dillard Margaret R
Bought by
Boggs Boyce E and Boggs Debbie W
Create a Home Valuation Report for This Property
The Home Valuation Report is an in-depth analysis detailing your home's value as well as a comparison with similar homes in the area
Home Values in the Area
Average Home Value in this Area
Purchase History
| Date | Buyer | Sale Price | Title Company |
|---|---|---|---|
| New Start Investments Llc | -- | None Available | |
| Piurkowski Melissa | $90,000 | None Available | |
| Daugherty James T | $50,000 | -- | |
| Branch Banking & Trust Co Of Sc | $500 | -- | |
| Boggs Boyce E | $7,002 | -- |
Source: Public Records
Mortgage History
| Date | Status | Borrower | Loan Amount |
|---|---|---|---|
| Previous Owner | Daugherty James T | $45,000 |
Source: Public Records
Tax History Compared to Growth
Tax History
| Year | Tax Paid | Tax Assessment Tax Assessment Total Assessment is a certain percentage of the fair market value that is determined by local assessors to be the total taxable value of land and additions on the property. | Land | Improvement |
|---|---|---|---|---|
| 2025 | $2,251 | $6,210 | $1,138 | $5,072 |
| 2024 | $2,251 | $6,210 | $1,138 | $5,072 |
| 2023 | $2,251 | $6,210 | $1,138 | $5,072 |
| 2022 | $2,070 | $5,400 | $936 | $4,464 |
| 2021 | $2,070 | $5,400 | $936 | $4,464 |
| 2020 | $1,386 | $3,600 | $936 | $2,664 |
| 2019 | $1,385 | $3,600 | $936 | $2,664 |
| 2018 | $1,670 | $4,457 | $911 | $3,546 |
| 2017 | $1,467 | $3,876 | $750 | $3,126 |
| 2016 | $1,446 | $3,876 | $750 | $3,126 |
| 2015 | $1,422 | $3,876 | $750 | $3,126 |
| 2014 | $1,421 | $3,876 | $750 | $3,126 |
Source: Public Records
Map
Nearby Homes
- 820 Redmill Ln
- 636 Sunwater Dr
- 1312 Duncan Reidville Rd
- 254 Twilitemist Dr
- 714 Thistlewood Dr
- 107 Brandy Mill Chase
- 624 S Morningwood Ln
- 408 Royalston Ct
- 344 Lansdowne St
- 3025 Olivette Place
- 3048 Olivette Place
- 3052 Olivette Place
- 1009 Rogers Bridge Rd
- 1013 Rogers Bridge Rd
- 159 Rockingham Rd
- 167 Rockingham Rd
- 163 Rockingham Rd
- 253 Golden Bear Walk
- 1055 Summerlin Trail
- 1011 Rogers Bridge Rd
- 316 Buckingham Rd
- 312 Buckingham Rd
- 816 Redmill Ln
- 808 Redmill Ln
- 308 Buckingham Rd
- 310 Buckingham Rd
- 804 Redmill Ln
- 800 Redmill Ln
- 500 Robinwood Place
- 102 Nottingham Cir
- 306 Buckingham Rd
- 317 Buckingham Rd
- 817 Redmill Ln
- 813 Redmill Ln
- 821 Redmill Ln
- 501 Robinwood Place
- 412 Granbury Dr Unit RP77 5/2
- 412 Granbury Dr
- 512 Redmill Ln
- 829 Redmill Ln